Introduction
Oil refining and petrochemicals are among the key export-oriented sectors of the Belarusian economy. The products of JSC Mozyr Oil Refinery, JSC Naftan, the Polymir plant of JSC Naftan, and related production and logistics organizations form a significant segment of the freight base of the Belarusian Railway.
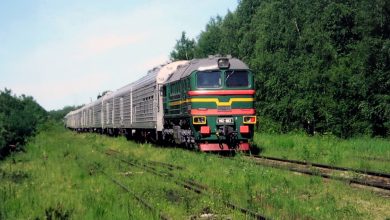
Railway transport plays a special role in the export of petroleum products, petrochemical products, liquefied petroleum gases, oils, and other specialized cargoes. For this category of products, the railway is not only a means of delivery but also part of a unified production and logistics chain linking manufacturing enterprises, originating stations, specialized rolling stock, railway administrations, transshipment terminals, and consignees.
The stability of such transport depends on the coordinated operation of all elements of the chain. Restrictions on the capacity of interstate interchange points, disruption of port terminal operations, shortages of liquid cargo handling capacity, or delays in unloading can lead to route changes, increased railcar turnaround times, accumulation of rolling stock, and redistribution of freight flows between other segments of the transport system.
The Belarusian Railway Community has previously published studies on the structure of freight transport on the Belarusian Railway and the directions of Belarusian product exports.
The material “Analysis of freight transport on the Belarusian Railway in 2024: volumes, structure, and dynamics compared to 2023” examined the overall performance indicators of the Belarusian Railway, the structure of the freight base, and changes by major nomenclature groups. According to the data provided, the volume of transport in the consolidated category “oil and petroleum products” decreased from 14.29 million tonnes in 2023 to 11.43 million tonnes in 2024. Despite the decline, this category retained a notable place in the railway's transport structure.
The network-wide category “oil and petroleum products” covers all types of traffic and is therefore broader than the export of specific enterprises examined below. These indicators provide general context but are not used for direct calculation of dynamics by company.
In the study “Railway export of Belarusian cargoes for 9 months of 2024. Part 1: Russia”, export flows were examined in greater detail—broken down by enterprise, cargo, consignee, and type of rolling stock. Separate subsections covered the transport of Mozyr Oil Refinery, Naftan, the Polymir plant, Logistic Energy LLC, Belorusneft-Trans State Enterprise, and SG-Trans Republican Unitary Enterprise. The material showed that shipments to Russia and through Russian seaports had by that time already become one of the main elements of the export logistics of the Belarusian oil refining and petrochemical industry.
Following restrictions on access to some traditional routes through European Union countries and Ukrainian territory, a significant share of Belarusian export flows was redirected to Russian transport infrastructure. Russian railways, port-adjacent stations, and transshipment complexes became the main elements of delivery of Belarusian products both to consignees in Russia and to third countries.
At the same time, the new logistics model increased dependence on individual routes and terminals. This was particularly evident in the transport of gasoline through the port of Ust-Luga and Luzhskaya station of the Oktyabrskaya Railway.
The material “Gasoline exports from Belarus to third countries have been falling since the beginning of 2025; UAV attacks on Ust-Luga infrastructure are exacerbating the situation” noted that the reduction in transport on this route began even before damage to port infrastructure. In the nine months of 2024, 1.57 million tonnes of Belarusian gasoline were dispatched via Ust-Luga, whereas in the same period of 2025 the figure was 772 thousand tonnes, or 50.8% less. Subsequent restrictions on terminal operations further demonstrated the vulnerability of an export scheme in which a significant volume of one product type was concentrated on a single route.
Therefore, analysis of railway export of petroleum products cannot be limited to the total number of railcars and the mass of transported cargoes. It is necessary to take into account the distribution of flows between enterprises, commodity groups, destination stations, and terminals, as well as the degree of concentration of transport and the availability of alternative routes.
The article examines:
- the total volume and commodity structure of railway exports;
- the distribution of cargoes between shipments to the Russian Federation and exports to third countries via Russian ports;
- the operations of the largest Belarusian enterprises and logistics organizations;
- the geography of destination stations and the composition of consignees;
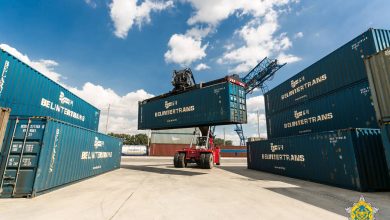
- the transport of liquefied petroleum gases, oils, lubricants, petrochemical products, and containerized cargoes;
- changes that occurred in the structure of transport in January–April 2026 relative to the results of 2025.
Shipments to Crimea and other occupied territories of Ukraine are included in the overall freight flow indicators. In the article they are considered only as part of the overall geography; these routes are examined in detail in a separate publication by the Belarusian Railway Community.
The material covers two periods:
- 2025;
- January–April 2026.
The geographical scope of the study is limited to Russian and Baltic directions. The article examines transport to stations on the network of Russian railways, including export stations and port terminals, as well as direct shipments to Latvia and Lithuania. Other foreign directions are not included in the material. Therefore, the indicators provided characterize the segment of railway exports under consideration, not the entire export of petroleum products and petrochemical products from Belarus.
For the article, detailed information on railway shipments was processed: shipper, originating station, railway and destination station, consignee, cargo name and code according to the Uniform Freight Nomenclature, type of railcar, number of railcars, and mass. Such detail makes it possible to trace the railway portion of the route and assess the concentration of freight flows.
The calculations are based on operational information on railway shipments. The direction is determined by the destination station and railway and does not always coincide with the final market of consumption. The consignee on the waybill may be an industrial enterprise, terminal, warehouse, or logistics operator; after port transshipment, the onward route and final country are not traced. Therefore, the expression “export to third countries via Russian ports” is used in the article as a designation of shipments to Russian stations and terminals with an export designation, not as confirmation of the final country of destination. The term “railcar” hereafter includes tank cars, gondola cars, and railcars for transporting containers.
For 2025, the enterprises and commodity categories examined dispatched 70,284 railcars totaling 4.04 million tonnes. For January–April 2026, the volume of transport amounted to a further 34,941 railcars and 2.03 million tonnes.
The indicators are calculated from operational data and may be refined. Individual minor discrepancies between the number of railcars and the calculated mass do not change the overall assessment of volumes, commodity structure, and main directions of transport.
The results make it possible to determine the scale of railway export of Belarusian petroleum products and petrochemical products, trace changes in port and Russian logistics, and assess the role of individual enterprises, terminals, and commodity groups in forming the freight flow.
Key Points
- In 2025, the enterprises and logistics organizations examined dispatched by railway 70,284 railcars totaling 4.04 million tonnes. For January–April 2026, a further 34,941 railcars and 2.03 million tonnes were transported—50.1% of the entire 2025 result. The average monthly tonnage for the first four months was 50.3% higher than the average for 2025; this is a comparison of intensity, not year-on-year dynamics.
- Via Russian port nodes or to destinations on the network of Russian railways passed 99.3% of tonnage in 2025 and 99.93% in January–April 2026. Direct transport to Latvia and Lithuania for both periods amounted to less than 0.5% of the total volume. Russian transport infrastructure effectively became the foundation of the entire export scheme examined.
- The structure of shippers changed sharply. Mozyr Oil Refinery retained first place, but its share fell from 59.3 to 50.0%. The share of Belorusneft-Trans State Enterprise rose from 18.2 to 37.4%, and in the four months of 2026 the company dispatched a greater volume than in the whole of 2025. At the same time, the average monthly indicators for Naftan and Logistic Energy LLC were lower than the 2025 average by 21.3 and 55.5% respectively.
- The commodity structure remained predominantly fuel-based. Gasolines, fuel oil, diesel and jet fuel, and in 2025 also gas oil, accounted for 82.7% of tonnage in 2025 and 83.2% in January–April 2026. The share of gasoline and fuel oil fell from 69.2 to 65.0%, while the average monthly volumes of diesel and jet fuel, as well as oils, were noticeably higher than the 2025 average.
- Port geography became broader within the Russian system, but no independent alternative to it emerged. The reduction in the northwestern leg began in the second half of 2024. In the 2025 transport examined, southern and Caspian destinations occupied a more prominent place, and in January–April 2026 the share of Luzhskaya declined, while Avtovo, Trusovo, and Novolesnaya occupied a more prominent place in the port flow.
- For Logistic Energy LLC, a key new element was the Murmansk port direction, recorded for the first time in data available to the Community. Via this route, 192 railcars with 10,752 tonnes of gasoline passed through Kola (exp.) station addressed to First Murmansk Terminal LLC. The route expanded geography, but its average monthly volume remained 71.4% lower than the company's previous gasoline flow via Luzhskaya to Portenergo.
- Higher average monthly intensity was accompanied by increased concentration. In January–April 2026, Barbarov and Novopolotsk stations accounted for 99.9% of tonnage, and four stations and four terminal consignees accumulated around 95% of the port flow. Opportunities for redistribution within the Russian network increased, but dependence on two Belarusian nodes and a limited number of terminals persisted.
Section I. Railway export of Belarusian petroleum products and petrochemical products in 2025
1.1. Total volume, commodity structure, and geography of transport
In 2025, for the enterprises and commodity items examined, 70,284 railcars totaling 4,043,441 tonnes were dispatched by railway transport.
The main direction was export to third countries via Russian export stations and port terminals. Via this route passed 43,492 railcars and 2,587,446 tonnes of cargoes—64.0% of the aggregate tonnage.
Shipments in the direction of the Russian Federation amounted to 26,010 railcars and 1,427,474 tonnes, or 35.3%. Direct exports to Latvia and Lithuania occupied a significantly smaller share: the two directions accounted for 782 railcars and 28,521 tonnes—around 0.7% of the total volume.
| Direction | Railcars | Mass, t | Share, % |
| Export to third countries via Russian export stations and terminals | 43,492 | 2,587,446 | 64.0% |
| Shipments in the direction of the Russian Federation | 26,010 | 1,427,474 | 35.3% |
| Direct export to Latvia | 751 | 26,599 | 0.66% |
| Direct export to Lithuania | 31 | 1,922 | 0.05% |
| Total | 70,284 | 4,043,441 | 100% |
Commodity structure
The transport covered 27 freight items of the Uniform Freight Nomenclature. For comparison, they are grouped into consolidated commodity groups taking into account the purpose of the products and the characteristics of their transport.
The largest group was gasolines—31,521 railcars and 1,766,846 tonnes. They accounted for 43.7% of the aggregate tonnage. The main part of this group consisted of motor gasoline—1,747,638 tonnes. Transport of gasoline for industrial purposes reached 16,128 tonnes, other gasolines—3,080 tonnes.
Via Russian export stations and terminals, 1,390,928 tonnes of gasolines were dispatched; in the direction of the Russian Federation—375,918 tonnes. Thus, around 79% of transport in this commodity group was associated with further export via Russian port infrastructure.
The second largest item was fuel oil—15,873 railcars and 1,031,612 tonnes, or 25.5% of total tonnage. Via Russian export stations passed 911,235 tonnes of fuel oil; in the direction of the Russian Federation—120,377 tonnes. The share of the port direction in this group reached 88.3%.
Diesel fuel, gas oil, and jet fuel together formed 8,739 railcars and 543,867 tonnes. This sum included:
- diesel fuel—391,588 tonnes;
- gas oil—96,395 tonnes;
- jet fuel—55,884 tonnes.
Unlike gasoline and fuel oil, the main part of this group was directed to the Russian Federation—361,824 tonnes versus 182,043 tonnes via export stations and terminals.
The three largest groups—gasolines, fuel oil, and diesel and jet fuel with gas oil—accounted for 3,342,325 tonnes, or 82.7% of all transport examined.
Commodity groups: volume and share in 2025 transport
| Cargo group | Railcars | Mass, t | Share, % |
| Gasolines | 31,521 | 1,766,846 | 43.7% |
| Fuel oil | 15,873 | 1,031,612 | 25.5% |
| Diesel, jet fuel, and gas oil | 8,739 | 543,867 | 13.5% |
| Petroleum coke and feedstock for carbon black production | 6,204 | 288,669 | 7.1% |
| Oils and lubricants | 3,305 | 204,754 | 5.1% |
| LPG and hydrocarbon fractions | 3,013 | 110,293 | 2.7% |
| Shippers' products in containers | 853 | 47,656 | 1.2% |
| Other petrochemical products | 467 | 29,822 | 0.7% |
| Other chemical cargoes and petroleum products | 309 | 19,922 | 0.5% |
| Total | 70,284 | 4,043,441 | 100% |
Distribution of commodity groups by direction in 2025, tonnes
| Cargo group | Via Russian ports | In the direction of the RF | Directly to Latvia and Lithuania |
| Gasolines | 1,390,928 | 375,918 | — |
| Fuel oil | 911,235 | 120,377 | — |
| Diesel, jet fuel, and gas oil | 182,043 | 361,824 | — |
| Petroleum coke and feedstock for carbon black production | 8,910 | 279,759 | — |
| Oils and lubricants | 88,660 | 114,172 | 1,922 |
| LPG and hydrocarbon fractions | 518 | 83,176 | 26,599 |
| Shippers' products in containers | 5,152 | 42,504 | — |
| Other petrochemical products | — | 29,822 | — |
| Other chemical cargoes and petroleum products | — | 19,922 | — |
| Total | 2,587,446 | 1,427,474 | 28,521 |
Petroleum coke and feedstock for carbon black production were oriented almost exclusively to the Russian direction: 279,759 of 288,669 tonnes of this product went to the Russian Federation.
Transport of oils and lubricants amounted to 3,305 railcars and 204,754 tonnes. Of these, 114,172 tonnes were directed to the Russian Federation, 88,660 tonnes via Russian export stations, and a further 1,922 tonnes directly to Lithuania. This group includes 27 railcars with 1,512 tonnes of oil in containers.
The volume of transport of liquefied petroleum gases and related hydrocarbon fractions reached 3,013 railcars and 110,293 tonnes. The direction of the Russian Federation accounted for 83,176 tonnes, direct export to Latvia for 26,599 tonnes, and a further 518 tonnes went to Kerch-Yuzhnaya station with the designation “exp.” The indicator includes 132 railcars with 3,696 tonnes of LPG in containers. The segment is examined in detail in subsection 1.7.
Other petrochemical products include benzene, pyrocondensate, pyrobenzene, acrylonitrile, petroleum resins, and acetone cyanohydrin. The total volume of these cargoes amounted to 29,822 tonnes.
Separately accounted for are 853 railcars with 47,656 tonnes of shippers' products in containers. The Uniform Freight Nomenclature code in these cases reflects the method of transport, so more detailed commodity breakdown is not provided. Containerized consignments with confirmed contents are already included in the LPG and oils groups.
Geography of origination
The formation of freight flow was concentrated predominantly at two stations of the Belarusian Railway.
From Barbarov station of the Gomel division of the Belarusian Railway, 47,420 railcars and 2,823,185 tonnes of cargoes were dispatched—69.8% of total tonnage. The station served primarily the transport of Mozyr Oil Refinery and other organizations associated with shipments of products from the Mozyr industrial hub.
From Novopolotsk station of the Vitebsk division of the Belarusian Railway passed 19,692 railcars and 1,055,866 tonnes, or 26.1%. Through it were formed the transport of JSC Naftan, the Polymir plant, and part of the products of other shippers of the Novopolotsk industrial hub.
Together, Barbarov and Novopolotsk accounted for 3,879,051 tonnes, or 95.9% of the entire freight flow. Vitebsk station accounted for 132,896 tonnes, Vitba for 27,339 tonnes. A further 4,155 tonnes were dispatched from Rechytsa and Shabany or accounted for without indication of a specific station.
Export via Russian stations and terminals
The port freight flow was concentrated predominantly on the Oktyabrskaya and Privolzhskaya railways. Export stations of the Oktyabrskaya Railway accounted for 1,928,713 tonnes, Privolzhskaya for 554,000 tonnes. Together they accounted for 96.0% of this direction.
The largest export station by tonnage was Avtovo—952,180 tonnes. Luzhskaya ranked first by number of railcars—16,865 units—and second by mass with a negligible lag: 947,257 tonnes.
Via Trusovo, 349,134 tonnes were dispatched; via Novolesnaya, 204,866 tonnes. Collectively, the four largest stations accounted for 94.8% of all tonnage passing through Russian export terminals.
| Russian export station | Railcars | Mass, t | Share, % |
| Avtovo (exp.) | 14,660 | 952,180 | 36.8% |
| Luzhskaya (exp.) | 16,865 | 947,257 | 36.6% |
| Trusovo (exp.) | 6,147 | 349,134 | 13.5% |
| Novolesnaya (exp.) | 3,583 | 204,866 | 7.9% |
| Novorossiysk (exp.) | 1,357 | 81,701 | 3.2% |
| Other export stations | 880 | 52,308 | 2.0% |
| Total | 43,492 | 2,587,446 | 100% |
The group of others included Predportovaya, Makhachkala, Shushary, Vyborg, and Kerch-Yuzhnaya.
The main volume was handled by four terminal consignees:
- JSC Petersburg Oil Terminal—952,180 tonnes;
- Portenergo LLC—926,912 tonnes;
- Terminal Ilyinka LLC—349,134 tonnes;
- Transoil Terminal LLC—204,866 tonnes.
Collectively, these four organizations accounted for 2,433,092 tonnes, or 94.0% of transport via Russian export stations and terminals. Such a structure indicates high concentration of port logistics: the main part of cargoes depended on a limited number of stations and transshipment complexes.
Shipments in the direction of the Russian Federation
Unlike the port segment, shipments in the direction of the Russian Federation had significantly more distributed geography: 240 destination stations on 15 railways.
The Oktyabrskaya Railway accounted for 566,614 tonnes, the Moskovskaya for 389,269 tonnes, the Severo-Kavkazskaya for 143,729 tonnes, the Yugo-Vostochnaya for 99,173 tonnes, the Zapadno-Sibirskaya for 64,699 tonnes. These five railways accounted for 88.5% of the tonnage of the direction.
The largest destination stations were:
- Luzhskaya — 5,119 railcars and 231,647 tonnes;
- Avtovo — 1,708 railcars and 107,408 tonnes;
- Enem I — 911 railcars and 51,016 tonnes;
- Krasny Bor — 791 railcar and 47,698 tonnes;
- Kombinatskaya — 1,187 railcars and 44,281 tonnes.
The five largest stations accounted for 482,050 tonnes, or 33.8% of deliveries to the Russian Federation. Even the top ten stations provided only 45.5% of the tonnage. This significantly distinguished this direction from port exports, where almost the entire flow was concentrated at four hubs.
Shipments to Luzhskaya and Avtovo marked “exp.” are included in port exports, while stations with the same name but without this mark are included in the Russian Federation direction. These categories are not summed together.
Mamlutka station belongs to the Petropavlovsk branch of the South Ural Railway, but is geographically located in the North Kazakhstan region of Kazakhstan. Therefore, 142 railcars and 8,816 tonnes are retained in the Russian Federation direction totals based on the railway affiliation of the station, and are highlighted as deliveries to Kazakhstan in the geographical breakdown.
Direct deliveries to Latvia and Lithuania
Direct exports to Latvia amounted to 751 railcars and 26,599 tonnes. The main part of the cargo flow went to Daugavpils station — 619 railcars and 22,903 tonnes of liquefied petroleum gases.
130 railcars with 3,640 tonnes of LPG in containers were sent to Mangali station. Another two railcars with 56 tonnes of containerized LPG batches proceeded to Indra station.
Direct deliveries to Lithuania amounted to 31 railcars and 1,922 tonnes. The entire cargo flow was directed to Rimkai station: 30 railcars and 1,866 tonnes of petroleum oils and lubricants, as well as one railcar with 56 tonnes of oil in a container.
Thus, the geography of transportation in 2025 combined a high concentration of shipments at Barbarov and Novopolotsk stations, the dependence of port exports on several large Russian terminals, and a significantly more diversified network of deliveries to the Russian Federation. Direct exports to Latvia and Lithuania remained, but accounted for less than 1% of the total tonnage.
1.2. JSC “Mozyr Oil Refinery”
JSC “Mozyr Oil Refinery” is one of the two largest oil refining enterprises in Belarus. The plant is located in the Gomel region and was commissioned in 1975. Its main products are automotive gasoline, diesel fuel, fuel oil, bitumen, and gas oils. This specialization directly determines the structure of the enterprise's railway transport.
In 2025, Mozyr Oil Refinery was the largest consignor among the enterprises considered. 39,783 railcars with a total mass of 2,398,278 tonnes were dispatched from Barbarov station of the Gomel branch of the Belarusian railway. The enterprise accounted for 59.3% of the total tonnage and 56.6% of railcars.
Automotive gasoline and fuel oil formed the basis of the cargo flow. 20,111 railcars with a total mass of 1,127,768 tonnes of unleaded motor gasoline were dispatched, and 15,108 railcars and 982,010 tonnes of fuel oil. Together, these two products accounted for around 88% of the enterprise’s total tonnage.
In addition, 157,542 tonnes of diesel fuel, 88,140 tonnes of gas oil, 23,919 tonnes of raw materials for carbon black production, and 11,115 tonnes of benzene were transported by railway transport. Another 7,784 tonnes accounted for the enterprise's products in containers and other gasolines.
Two directions were clearly distinguished in the structure of Mozyr Oil Refinery's transportation. 29,240 railcars with a total mass of 1,765,852 tonnes, or 73.6% of the enterprise's tonnage, passed through Russian export stations for further shipment to third countries. 10,543 railcars with a total mass of 632,426 tonnes, or 26.4%, were sent to recipients in the Russian Federation.
Mozyr Oil Refinery accounted for 68.2% of the port tonnage of all considered consignors and 44.3% of the tonnage of deliveries to the Russian Federation. There were no direct shipments from the enterprise to Latvia and Lithuania in 2025.
The port direction was concentrated at four export stations and four terminal operators, while deliveries to Russian recipients covered a significantly wider area.
Exports to third countries via Russian ports
The main part of Mozyr Oil Refinery's port flow passed through the Oktyabrskaya railway. Avtovo and Luzhskaya stations accounted for 28,246 railcars with a total mass of 1,710,188 tonnes — 96.8% of all the enterprise's transportation through Russian export stations.
JSC “Petersburg Oil Terminal” was the largest railway recipient. 14,348 railcars with a total mass of 931,900 tonnes, or 52.8% of Mozyr Oil Refinery's port tonnage, were sent to Avtovo station addressed to it. The main part of the deliveries consisted of fuel oil — 870,610 tonnes. In addition, the terminal received 46,410 tonnes of gas oil and 14,880 tonnes of diesel fuel.
The second main recipient was LLC “Portenergo”. 13,898 railcars of unleaded automotive gasoline with a total mass of 778,288 tonnes were received at Luzhskaya station addressed to it. This route accounted for another 44.1% of the enterprise's port tonnage.
Thus, JSC “Petersburg Oil Terminal” and LLC “Portenergo” together received 1,710,188 tonnes of products — almost 97% of the total volume sent by Mozyr Oil Refinery through Russian ports. Such concentration showed a high dependence of the enterprise's export logistics on the line capacity of the two terminal directions of the Oktyabrskaya railway.
Significantly smaller volumes passed through the Privolzhskaya railway. 876 railcars of gasoline with a total mass of 49,056 tonnes were sent to Trusovo station addressed to LLC “Terminal Ilyinka”. LLC “Transoil Terminal” at Novolesnaya station received another 118 railcars of gasoline weighing 6,608 tonnes. The combined share of these two routes was only 3.2% of the port flow.
Fuel oil — 870,610 tonnes and automotive gasoline — 833,952 tonnes predominated in the commodity structure of transportation through Russian export stations. Together they formed 96.5% of the port tonnage. Gas oil and diesel fuel occupied a significantly smaller share.
These organizations were terminal links in the export chain. Their volumes show the distribution of goods among Russian transshipment facilities, but not the structure of final product buyers in third countries.
Deliveries to the Russian Federation
Unlike the port direction, Mozyr Oil Refinery's deliveries to Russian recipients were characterized by a diversified geography: 13 railways, 120 destination stations, and 122 recipient names.
226,210 tonnes of products, or 35.8% of the Russian direction, were sent to the Moscow railway. The Oktyabrskaya railway received 155,576 tonnes, the North Caucasian — 98,496 tonnes, the South-Eastern — 78,000 tonnes. These four railways collectively accounted for 88.3% of deliveries to the Russian Federation.
At the same time, the concentration at the level of individual stations was significantly lower. The largest destinations were Enem I — 36,624 tonnes, Unecha — 33,470 tonnes, Kostomuksha-Tovarnaya — 29,657 tonnes, Safonovo — 28,925 tonnes, Titan — 28,774 tonnes, and Khrenovaya — 28,336 tonnes. No single station provided more than 5.8% of the enterprise's Russian tonnage.
Unleaded automotive gasoline remained the main cargo in the Russian direction — 293,816 tonnes, or 46.5%. 142,662 tonnes of diesel fuel, 111,400 tonnes of fuel oil, and 41,730 tonnes of gas oil were dispatched. Together, these four items formed 93.2% of deliveries to Russian recipients.
The largest individual recipient was LLC “LUKOIL-Yugnefteprodukt”. The company received 2,152 railcars of automotive gasoline with a total mass of 121,232 tonnes, which corresponded to 19.2% of Mozyr Oil Refinery's entire Russian direction. Deliveries were distributed among Enem I, Khrenovaya, Staromaryevskaya, Maykop, Sulin stations, and a number of other points on the North Caucasian and South-Eastern railways.
Two other large recipients named “Lukoil” — LLC “LUKOIL-Tsentrnefteprodukt” and LLC “LUKOIL-Severo-Zapadnefteprodukt” — received 29,808 and 29,046 tonnes, respectively. In total, the three Lukoil structures accounted for 180,086 tonnes, or 28.5% of Mozyr Oil Refinery's deliveries to the Russian Federation. The main part of this volume consisted of automotive gasoline.
The second largest individual recipient was LLC “Neftika” — 872 railcars and 53,136 tonnes. Deliveries were mainly directed to Unecha, Krasny Bor, Kardymovo, and Sven stations. Unlike the Lukoil structures, diesel fuel predominated in the volume of LLC “Neftika” — 43,896 tonnes.
Along with oil sales organizations, a group of large industrial enterprises was present among the recipients. JSC “Karelsky Okatysh” received 29,657 tonnes of fuel oil and diesel fuel at Kostomuksha-Tovarnaya station. LLC “Bitech” received 28,925 tonnes of fuel oil at Safonovo station, LLC “Kontur SPb” — 24,375 tonnes of gas oil at Avtovo station, Kirov branch of JSC “Apatit” — 22,608 tonnes, predominantly fuel oil.
A separate direction was formed by deliveries of raw materials for carbon black production. LLC “Omsk Technical Carbon Plant” and JSC “Yaroslavl Technical Carbon named after V. Yu. Orlov” received a total of 23,919 tonnes of such products. Another 17,355 tonnes of gas oil were sent to PJSC “Orsknefteorgsintez” at Nickel station.
Thus, Mozyr Oil Refinery's Russian cargo flow simultaneously served two groups of recipients: oil sales organizations distributing motor fuel, and industrial enterprises using fuel oil, gas oil, and coking chemicals.
Overall, the concentration of deliveries by recipients remained moderate. The largest addressee accounted for 19.2% of the tonnage, the five largest — 41.6%, and the ten largest — 58.7%. This significantly distinguished the Russian direction from the port direction, where almost the entire volume was concentrated at two terminal operators.
Almost all Mozyr Oil Refinery's cargo was transported in specialized tank cars. Tank cars of types CS, CSS, and CST accounted for 99.8% of the tonnage. The remaining 85 railcars transported the enterprise's products in large-capacity containers.
As a result, Mozyr Oil Refinery's railway logistics in 2025 combined two different models: a highly concentrated export flow through several Russian terminals and a diversified network of deliveries to Russian oil sales and industrial enterprises.
1.3. JSC “Naftan”
JSC “Naftan” is the Novopolotsk oil refinery and one of the basic enterprises of the oil refining industry in Belarus. The development of Novopolotsk is associated with its construction; it was at this enterprise that the first Belarusian gasoline was produced.
This section only considers shipments directly from JSC “Naftan”. Transportation by the “Polymir” plant, which is part of the enterprise's structure, is considered separately — in section 1.4.
All railway export of “Naftan” products in 2025 was carried out from Novopolotsk station of the Vitebsk branch of the Belarusian railway. The enterprise dispatched 10,767 railcars with a total mass of 575,421 tonnes — 14.2% of the total volume. By tonnage, “Naftan” became the third largest consignor after Mozyr Oil Refinery and SE “Belarusneft-Trans”.
Unlike Mozyr Oil Refinery, whose cargo flow was primarily oriented towards Russian port terminals, “Naftan” was dominated by deliveries to the Russian Federation. These accounted for 9,616 railcars and 507,425 tonnes, or 88.2% of the enterprise's volume. 1,151 railcars with a total mass of 67,996 tonnes — 11.8% — were sent to third countries through Russian ports.
Petroleum anode coke and petroleum oils formed the basis of the commodity structure. 235,540 tonnes of coke and 152,210 tonnes of oils were transported. Together, these two items provided 387,750 tonnes, or 67.4% of the enterprise's total railway export.
In addition, “Naftan” dispatched 67,704 tonnes of diesel fuel, 55,884 tonnes of jet fuel, 27,110 tonnes of automotive gasoline, and 19,586 tonnes of sulfuric acid. The four largest commodity items — coke, oils, diesel, and jet fuel — accounted for 88.9% of the total volume.
The commodity structure also determined the composition of the rolling stock used. Liquid bulk cargo was transported mainly in tank cars — these accounted for 339,825 tonnes, or 59.1% of the volume. Another 235,540 tonnes of petroleum coke were transported in gondola cars.
Exports to third countries via Russian ports
“Naftan”‘s port direction was characterized by high concentration. Of 67,996 tonnes, almost the entire volume — 65,296 tonnes, or 96.0% — was directed through the Novorossiysk export station.
The largest consignment consisted of 59,086 tonnes of petroleum oil, sent to LLC “Inmorterminall”. Another 6,210 tonnes of petroleum anode coke were received by LLC “Ruscon”. 2,700 tonnes of coke were transported through Predportovaya export station to LLC “Modul”.
Thus, the port flow included only two types of products: petroleum oils provided 86.9% of its tonnage, petroleum coke — 13.1%. The main route was Novopolotsk — Novorossiysk.
The recipients in the port direction represented the terminal and logistics link of transportation. After transshipment in Russian ports, the further distribution of products is not traced.
Deliveries to the Russian Federation
In the direction of the Russian Federation in 2025, 507,425 tonnes of “Naftan” products were dispatched. The main cargo was petroleum anode coke — 226,630 tonnes, or 44.7% of this direction. Petroleum oils formed 93,124 tonnes, diesel fuel — 67,704 tonnes, jet fuel — 55,884 tonnes. Together, these four items provided 87.4% of the tonnage.
Deliveries were distributed among ten Russian railways. The Oktyabrskaya railway accounted for 352,867 tonnes, or 69.5%, and the Moscow railway — 92,609 tonnes, or 18.3%. The combined share of the two railways reached 87.8%.
Deliveries covered 108 destination stations. 115 recipient names were found in the waybills; some of them may refer to the same organizations.
The largest destination hub was Luzhskaya station, which received 218,215 tonnes of petroleum coke. 113,005 tonnes were sent to LLC “Novotrans Aktiv”, and 105,210 tonnes to LLC “Ultramar”. These two companies received 96.3% of all coke sent by the enterprise to the Russian Federation.
Avtovo station was second in volume — 75,079 tonnes. The entire flow was addressed to LLC “Kontur SPb” and included 69,254 tonnes of petroleum oil and 5,825 tonnes of fuel oil.
Thus, Luzhskaya and Avtovo together received 293,294 tonnes, or 57.8% of deliveries to the Russian Federation. This concentration was primarily due to large consignments of coke and oils addressed to a limited number of recipients.
Next were Predportovaya station — 18,615 tonnes, Ob — 18,180 tonnes, Krasny Bor — 16,836 tonnes, Kardymovo — 16,368 tonnes, and Sofrino — 11,776 tonnes.
A separate group was formed by aviation fuel shipments. A total of 55,884 tonnes of jet fuel were dispatched. The largest recipients were JSC Sovex at Predportovaya station — 15,240 tonnes, JSC Aero Novosibirsk at Ob station — 13,320 tonnes, JSC Toplivno-Zapravochny Service at Airport station — 8,940 tonnes, and LLC Aerofuels at Borovichi station — 6,200 tonnes. The geography of these shipments indicates a formed supply chain for Russian airports and fueling complexes.
Diesel fuel had a more fragmented distribution structure. LLC Neftika received 17,360 tonnes, LLC Solid Smolensk — 8,556 tonnes, JSC Karelsky Okatysh — 7,564 tonnes. The latter delivery stands out because the recipient was a large industrial enterprise, not an oil depot or fuel company.
Automotive gasoline supplies were also oriented towards Lukoil's sales structures. Three organizations of the group received a total of 21,000 tonnes, or more than three-quarters of all automotive gasoline dispatched by Naftan in this direction.
Sulfuric acid was supplied primarily to industrial and chemical enterprises. In particular, LLC Coagulant received 7,540 tonnes, LLC Transchemical Express — 3,380 tonnes. Petroleum and mineral oils, in addition to a large consignment to Avtovo, were sent to JSC Iyulsky at Sofrino station and LLC Obninskorgsintez at Obninskoye station.
The three largest recipients — LLC Novotrans Aktiv, LLC Ultramar, and LLC Contour SPb — received 293,294 tonnes, or 57.8% of the Russian direction. The ten largest recipients accounted for 75.5%. The remaining volume was distributed among a wide network of oil depots, fuel operators, airport complexes, and industrial enterprises.
Routes to Luzhskaya, Avtovo, and Predportovaya without the “exp.” mark are accounted for in the direction of the Russian Federation. However, the terminal profile of several recipients does not confirm the final consumption of all these products on the territory of Russia.
Naftan's railway transport in 2025 was characterized by a combination of high concentration and broad geography. The main volume was formed by large consignments of petroleum coke and oils, routed through several hubs of the Oktyabrskaya railway. Simultaneously, diesel, jet fuel, gasoline, and industrial products were distributed among numerous recipients in different regions of Russia. The enterprise's port export remained relatively small and was almost entirely concentrated on petroleum oil supplies through Novorossiysk.
1.4. Polymir Plant of JSC Naftan
Polymir Plant is a separate structural unit of JSC Naftan, located in Novopolotsk. Unlike Naftan's own oil refining site, Polymir specializes in the production of petrochemical products and the processing of hydrocarbon raw materials into polymers, chemical intermediates, and other more deeply processed products.
The core product range of the enterprise includes high-pressure polyethylene, polyacrylonitrile fiber “Nitron-D”, acrylonitrile, acetonitrile, acetone cyanohydrin, ammonium sulfate, and various hydrocarbon fractions. The plant also produces polyethylene waxes, film, bags, pipes, and other polyethylene products. Polymir's products are used in plastics processing, manufacturing of packaging materials and cable insulation, in the textile industry, production of artificial fur, household chemicals, and other industries. This specialization allows the enterprise to be considered not as an ordinary supplier of petroleum products, but as an important link in petrochemical production chains.
In 2025, 1,188 railcars with 68,434 tonnes of Polymir plant products were dispatched from Novopolotsk station of the Vitebsk branch of the Belarusian railway. This accounts for about 1.7% of the total tonnage.
The direction of the Russian Federation accounted for 1,096 railcars and 63,282 tonnes, while Russian port stations accounted for 92 railcars and 5,152 tonnes. There were no direct shipments from the enterprise to Latvia and Lithuania.
| Direction | Railcars | Mass, t | Share, % |
| Deliveries to the Russian Federation | 1,096 | 63,282 | 92.5% |
| Export via Russian port stations | 92 | 5,152 | 7.5% |
| Total | 1,188 | 68,434 | 100% |
The largest item was the plant's products in large-capacity containers — 766 railcars and 42,896 tonnes, or 62.7% of all enterprise shipments.
The ETSNG container code reflects the method of transportation. Therefore, 42,896 tonnes are accounted for as Polymir products in containers without more specific product details.
Among items with specific product names, industrial gasoline predominated — 8,456 tonnes, petroleum pyrocondensate — 6,912 tonnes, and inhibited acrylonitrile — 5,066 tonnes. These three items accounted for 20,434 tonnes, or 80% of the mass of named goods.
| Cargo | Railcars | Mass, t | Share, % |
| Large-capacity containers | 766 | 42,896 | 62.7% |
| Industrial gasoline | 151 | 8,456 | 12.4% |
| Petroleum pyrocondensate | 108 | 6,912 | 10.1% |
| Inhibited acrylonitrile | 87 | 5,066 | 7.4% |
| Petroleum resins | 48 | 3,264 | 4.8% |
| Acetone cyanohydrin | 24 | 1,608 | 2.3% |
| Petroleum pyrogasoline | 4 | 232 | 0.3% |
Export via Russian port stations
All 5,152 tonnes of the port direction consisted of Polymir products in containers. 78 railcars and 4,368 tonnes passed through Novorossiysk station (exp.) — 84.8% of this flow. Another 14 railcars with 784 tonnes were sent to the St. Petersburg transport hub: 672 tonnes to Shushary (exp.) and 112 tonnes to Predportovaya (exp.).
The main consignee specified was LLC Novomorsnab — 76 railcars and 4,256 tonnes. The company is engaged in freight forwarding services and container handling at its own terminal in Novorossiysk. Another 112 tonnes were received by LLC RusCon, a container operator working in Novorossiysk. In the St. Petersburg hub, the recipients were LLC Voskhod — 672 tonnes and LLC Modul — 112 tonnes. These organizations are also associated with terminal, warehouse, and container logistics.
All recipients in the port direction were elements of the transport and logistics chain, not industrial enterprises. Containers were delivered to Russian terminals; subsequent sea routes, countries, and actual foreign consumers have not been established.
Deliveries to the Russian Federation
63,282 tonnes of products were transported to the Russian Federation. Polymir's containerized shipments accounted for 37,744 tonnes, or 59.6% of this volume. This was followed by industrial gasoline — 8,456 tonnes, petroleum pyrocondensate — 6,912 tonnes, inhibited acrylonitrile — 5,066 tonnes, petroleum resins — 3,264 tonnes, acetone cyanohydrin — 1,608 tonnes, and petroleum pyrogasoline — 232 tonnes.
Deliveries were distributed among nine railways, 32 stations, and 35 consignee names. The largest destination stations were Bazaiha — 20,048 tonnes, Mamlyutka — 8,816 tonnes, and Chepetskaya — 8,064 tonnes. These three stations accounted for 58.4% of the volume in this direction.
Mamlyutka station belongs to the Petropavlovsk branch of the South Ural Railway, but is located in the North Kazakhstan region of Kazakhstan. The recipients of all shipments at this station were Kazakh limited liability partnerships.
The railway affiliation of the station explains its inclusion in the Russian Federation direction. In the geographical structure, 8,816 tonnes are highlighted as deliveries to Kazakhstan.
Taking this clarification into account, the structure of Polymir's shipments by destination station location was as follows: 54,466 tonnes, or 79.6%, went to internal stations in Russia; 8,816 tonnes, or 12.9%, to Mamlyutka station in Kazakhstan; and another 5,152 tonnes, or 7.5%, to Russian export terminals.
Among the largest recipients were industrial enterprises, transport operators, terminals, and trading organizations. Their profile helps to more accurately determine the role of each link in the transportation.
| Recipient | Station | Mass, t |
| LLC Neftekhimicheskaya Transportnaya Kompaniya | Bazaiha | 20,048 |
| LLC GaloPolymer Kirovo-Chepetsk | Chepetskaya | 8,064 |
| LLP SK Oil Corporation | Mamlyutka | 5,346 |
| LLC Tsikl Terminal | Malchiki | 4,880 |
| LLP Megapolis Systems | Mamlyutka | 3,470 |
| JSC Korund-Sistemy | Igumnovo | 1,608 |
The largest recipient according to waybills was LLC Neftekhimicheskaya Transportnaya Kompaniya — 20,048 tonnes, or 31.7% of the direction's volume. The company calls itself one of the largest Russian railway operators for liquefied gases and petrochemical products. Therefore, Bazaiha should be considered primarily as a large logistics hub, rather than a confirmed final consumption point for Polymir products.
LLC GaloPolymer Kirovo-Chepetsk, which received 8,064 tonnes of Polymir products in containers, has a different profile. This is an active chemical enterprise producing fluoropolymers, fluororubbers, fluorinated gases, and inorganic chemical products. The recipient belongs to the industrial sector, but the specific purpose of the containerized consignment has not been established.
All 5,346 tonnes of petroleum pyrocondensate intended for LLP SK Oil Corporation were delivered to Mamlyutka station. According to open registration data, the organization's profile is related to warehousing and storage of non-food products. Therefore, the company most likely acted as a warehouse or commercial link, rather than a processing enterprise.
The same station received 3,470 tonnes for LLP Megapolis Systems, including 1,566 tonnes of pyrocondensate and 1,904 tonnes of Polymir products in containers. The main registered activity of the company is wholesale trade in chemical substances and chemical products. This rather indicates a trading and intermediary function of the recipient.
LLC Tsikl Terminal received 4,648 tonnes of industrial gasoline and 232 tonnes of petroleum pyrogasoline. The company operates an oil depot near Malchiki station, intended for storing and transshipping light petroleum products. Consequently, this flow also initially went not directly to a production site, but to a facility for accumulation and subsequent distribution of products.
The most obvious production chain can be traced in the deliveries of 1,608 tonnes of acetone cyanohydrin for JSC Korund-Sistemy in Dzerzhinsk. The enterprise specializes in the production of methyl methacrylate and methacrylic acid, and acetone cyanohydrin is a raw material for methyl methacrylate production. In this case, the cargo was highly likely intended directly for further chemical processing.
Industrial recipients also include LLC Zavod Orgsyntez OKA, enterprises Omsky Kauchuk, Korund-Tsian, Saratovorgsintez, and a number of other chemical production facilities. A significant part of the consignments was transported in containers, so it is impossible to link each of them to a specific production process.
The five largest recipients by waybills accounted for 66.1% of shipments, and the ten largest — about 80%. These shares characterize the concentration of the first established logistics link, not the final demand. The largest flow went to a railway operator, and several other significant consignments went to terminal, warehouse, and trading organizations.
Thus, Polymir plant's railway dispatches in 2025 formed two different types of logistics chains. The first included deliveries of chemical raw materials directly to industrial enterprises, where the connection between acetone cyanohydrin and methyl methacrylate production is most clearly traceable. The second passed through railway operators, oil depots, container terminals, and trading companies, which could provide storage, transshipment, distribution, or further sale of products.
The predominance of containerized shipments and a significant share of intermediaries among recipients do not allow for a complete reconstruction of the product structure and identification of all final consumers. The consignee on the waybill in this case is the first established link after the sender, and not necessarily the final buyer of Polymir products.
1.5. SE Belorusneft-Trans
Unlike the oil refining enterprises discussed in previous sections, SE Belorusneft-Trans is not a producer of petroleum products. It is a transport and logistics enterprise within the Belorusneft system, engaged in organizing transportation, delivering fuel from oil depots, and performing loading and unloading operations. The main activity indicated in the registration data of the enterprise is freight road transport, and industry materials and company procurements confirm its specialization in transport logistics of petroleum products.
Therefore, the presence of Belorusneft-Trans in railway waybills as a consignor does not mean that the enterprise independently produced the specified products. In this case, it acts as an organizational link between oil refining enterprises, the railway, and the consignees.
In 2025, 12,840 railcars with a total mass of 734,396 tonnes were dispatched on behalf of Belorusneft-Trans — about 18.2% of the total transportation volume.
The main part of the products was directed through Russian port terminals:
| Direction | Railcars | Mass, t | Share, % |
| Export via Russian ports | 10,359 | 594,687 | 81.0% |
| Deliveries to the Russian Federation | 2,481 | 139,709 | 19.0% |
| Total | 12,840 | 734,396 | 100% |
Shipments were processed from two stations serving the main oil refining centers of Belarus. 398,859 tonnes, or 54.3% of the enterprise's volume, were dispatched from Barbarov station: all these goods went to Russian ports. Novopolotsk station accounted for 335,537 tonnes, or 45.7%: 195,828 tonnes were directed through port infrastructure, and another 139,709 tonnes — to the Russian Federation.
This geography confirms the logistical role of the enterprise: Belorusneft-Trans consolidated products from the two largest oil refining hubs in the country in its shipments.
Light petroleum products sharply predominated in the product structure. 480,144 tonnes of automotive gasoline were dispatched, or 65.4% of the total volume, and 166,342 tonnes of diesel fuel with a flash point above 61 °C, or 22.7%. Together, these two categories formed 646,486 tonnes — 88.0% of all enterprise shipments.
The remaining volume accounted for 31,000 tonnes of light mineral oils, 29,210 tonnes of petroleum anode coke, 17,856 tonnes of petroleum oils, 8,255 tonnes of gas oil, 1,527 tonnes of fuel oil, and a small consignment of 62 tonnes of spent industrial and motor oils.
Export via Russian ports
594,687 tonnes of products in 10,359 railcars were directed through Russian port stations. The basis of this flow was also automotive gasoline — 444,360 tonnes and diesel fuel — 112,498 tonnes. Together, they accounted for 93.6% of port shipments.
The geography of transportation was characterized by a high concentration in the Caspian direction. A total of 520,850 tonnes, or 87.6% of the entire Belorusneft-Trans port flow, arrived at Trusovo, Novolesnaya, and Makhachkala stations.
Trusovo station became the largest destination, where 300,078 tonnes of petroleum products were sent to LLC Terminal Ilyinka. Of these, 246,232 tonnes were automotive gasoline and 53,846 tonnes were diesel fuel. Terminal Ilyinka is an oil loading complex that provides for the reception of products from railway tank cars, storage, and subsequent transshipment into tankers. Consequently, the terminal is an intermediate logistics link, not the final consumer of the cargo.
Another 198,258 tonnes arrived at Novolesnaya station for LLC Transoil Terminal, including 154,672 tonnes of gasoline and 43,586 tonnes of diesel fuel. The enterprise carries out the reception, storage, and shipment of petroleum products, including gasoline, diesel fuel, kerosene, and oils. This recipient should also be considered as a transshipment complex, not a final sales market.
Thus, only two Astrakhan terminals received 498,336 tonnes — 83.8% of the total volume dispatched by Belorusneft-Trans through Russian ports.
The Northwestern direction accounted for 61,800 tonnes. The largest recipient here was LLC Portenergo: 36,008 tonnes of automotive gasoline arrived at Luzhskaya station for it. Portenergo operates an export terminal in Ust-Luga for transshipment of liquefied petroleum gases and light petroleum products.
Another 21,142 tonnes of light mineral oils were delivered to Predportovaya station for LLC Modul. The company is a multimodal terminal and logistics operator and provides for the reception, storage, and further shipment of goods by railway transport and sea.
22,514 tonnes of petroleum products passed through Makhachkala station to LLC Global Trade. The typical name does not allow for reliable determination of this organization's profile, so it is considered only as a consignee on the waybill, without drawing conclusions about its status as a final buyer or trader.
The five largest recipients — Terminal Ilyinka, Transoil Terminal, Portenergo, Global Trade, and Modul — accumulated 578,000 tonnes, or 97.2% of the port flow. However, this indicator primarily reflects the concentration of transshipment infrastructure. It does not allow for determining the number of final buyers or the geography of deliveries after transshipment of products to sea transport.
Deliveries to the Russian Federation
139,709 tonnes of products in 2,481 railcars were dispatched to the Russian Federation. All shipments were made from Novopolotsk station.
The largest product category was diesel fuel — 53,844 tonnes, or 38.5% of the volume in this direction. 35,784 tonnes of automotive gasoline, 29,210 tonnes of petroleum anode coke, and 17,112 tonnes of petroleum oils were dispatched. Another 2,232 tonnes accounted for light mineral oils and 1,527 tonnes for fuel oil.
Shipments were distributed among nine railways and 74 stations. The Moscow railway accounted for 45,872 tonnes, the Oktyabrskaya railway for 43,591 tonnes, and the North Caucasian railway for 32,056 tonnes. Together, these three railway administrations ensured the reception of 87.0% of the products in this direction.
The largest recipient was LLC LUKOIL-Yugnefteprodukt, which received 16,128 tonnes of automotive gasoline. The company manages oil depots and a network of gas stations, therefore it represents a sales and distribution link, not a single industrial consumer.
Another 5,880 tonnes of gasoline arrived at LLC LUKOIL-Severo-Zapadnefteprodukt, and 3,360 tonnes at LLC LUKOIL-Tsentrnefteprodukt. Collectively, the three regional sales structures of LUKOIL received 25,368 tonnes, or 18.2% of the direction's volume.
Shipments of petroleum anode coke require special attention. All 29,210 tonnes of this product were sent to three recipients:
- LLC Ultramar — 13,432 tonnes;
- LLC Cargo — 9,154 tonnes;
- PJSC Novorossiysk Commercial Sea Port — 6,624 tonnes.
Ultramar operates a marine transshipment terminal in Ust-Luga, and LLC Cargo is a terminal and logistics operator in Novorossiysk. PJSC NMTP also belongs to port infrastructure.
All 29,210 tonnes of anode coke went to port and terminal operators — LLC Ultramar, LLC Cargo, and PJSC Novorossiysk Commercial Sea Port. These shipments are part of the Russian Federation direction, but their internal consumption cannot be confirmed: after the terminal, the further route of the cargo is not traceable.
Among other large addressees were LLC Ilkom — 7,626 tonnes, LLC Neftika — 7,594 tonnes, and LLC Contour SPb — 5,518 tonnes. The latter company specializes in supplying bunker fuel and oils, as well as servicing fleets in seaports, meaning it is also part of the distribution and port chain.
Unlike the port direction, deliveries to Russian recipients were distributed relatively widely. The five largest addressees accumulated 38.6% of the tonnage, and the ten largest — about 58.3%. However, the composition of recipients shows that here too a significant part of the products went not to final consumers, but to oil depots, sales structures, terminals, and port operators.
The total volume of the direction also includes 3,442 tonnes of goods sent to stations of the Crimean and Luhansk railways. These shipments are analyzed in more detail in a separate publication by the Belarusian Railway Community.
Thus, in 2025, Belorusneft-Trans performed the function of a large logistics operator, consolidating railway shipments of petroleum products from the Mozyr and Novopolotsk industrial hubs. About 81% of the tonnage was directed through Russian port infrastructure, with 83.8% of this flow received by only two Astrakhan terminals.
Deliveries to the Russian Federation were characterized by a wider geography and lower concentration of recipients than the port flow. However, among the addressees were terminals, oil depots, and sales organizations, so the destination station did not always coincide with the final consumption market.
1.6. LLC Logistic Energy
LLC Logistic Energy cannot be considered solely as an ordinary transport and logistics company. Previously, the Belarusian Railway Community has already thoroughly studied the history of its appearance, the composition of its participants, and its rapid entry into the ranks of the largest freight forwarders of the Belarusian railway.
The company was registered on September 6, 2021 — less than a month after the United States imposed sanctions against Nikolai Vorobey and his controlled LLC BelKazTrans. The US Treasury Department explicitly stated that BelKazTrans was directly or indirectly owned or controlled by Vorobey. LLC Interservice, associated with the entrepreneur, was also included in the sanctions lists.
Formally, Nelly Malyarova is the sole owner of Logistic Energy. However, journalistic investigations link the company to Nikolai Vorobey's business circle. According to “Bureau”, Malyarova previously worked at Interservice, and in 2019–2021 — at BelKazTrans. Initially, Logistic Energy was registered at the same address as BelKazTrans and engaged in similar transport and forwarding activities.
As previously reported by the Belarusian Railway Community in a publication about the project of the so-called Belarusian Sea Port, already in 2022, Logistic Energy entered the top five largest freight forwarders of the Belarusian Railway with a monthly freight payment volume of about $3 million. The company participated in export shipments of petroleum products from Mozyr Oil Refinery and Naftan through Russian ports.
The company's connection with port logistics further developed in 2024. LLC Logistic Energy became the owner of 99% of the Russian LLC Marine Terminal “Gates of the Arctic”, created for the construction of a complex for transshipment of Belarusian goods in the Murmansk region. The remaining 1% belonged directly to Nelly Malyarova, who simultaneously controlled 100% of Logistic Energy.
Nikolai Vorobey is not formally listed among the owners or managers of Logistic Energy. However, journalistic investigations link the company to his business circle, pointing to personnel connections, a common initial address with BelKazTrans, a similar activity profile, and the transfer of large export flows.
Collapse of shipments in 2025
In 2024, Logistic Energy was one of the largest private participants in the railway export of Belarusian petroleum products.
For January–September 2024 alone, the company dispatched 17,412 railcars with a total mass of 1,077,268 tonnes. Of these, 1,062,373 tonnes, or 98.6%, went through Russian seaports. Another 14,895 tonnes accounted for the Russian Federation direction. More details — in the analysis of railway exports for the first nine months of 2024.
By the end of 2024, the company transported over 19,000 tank cars with more than 1.2 million tonnes of petroleum products. It accounted for about a quarter of the corresponding railway deliveries from Belarus in the Russian direction.
In 2025, the situation changed radically: according to operational data, Logistic Energy acted as the consignor for only 2,636 railcars with a total mass of 153,241 tonnes.
Even the entire volume of 2025 was 85.8% less than the company transported in the first nine months of 2024 alone. The difference in periods does not allow for a year-on-year comparison, but the scale of the reduction remains unambiguous.
The change in the same gasoline flow along the Vitebsk — Luzhskaya (exp.) — LLC Portenergo route is most indicative. For January–September 2024, the company dispatched 4,685 railcars and 281,100 tonnes of gasoline, and for the same period in 2025 — 2,011 railcars and 112,616 tonnes. In Q4 2025, there were no shipments along this chain, so the nine-month figure coincides with the full-year result.
Here, the period, cargo, destination station, and recipient completely coincide. The number of railcars decreased from 4,685 to 2,011, or by 57.1%, and the tonnage — from 281,100 to 112,616 tonnes, or by 59.9%. This confirms the collapse of this comparable gasoline route.
Logistic Energy reduced gasoline shipments faster than the Mozyr Oil Refinery. For the same nine-month periods, the Mozyr Oil Refinery's tonnage to the Portenergo terminal decreased by 49.0%, while Logistic Energy's tonnage decreased by 59.9%.
At the same time, the product structure sharply narrowed. For the first nine months of 2024, the company dispatched:
- 617,148 tonnes of diesel fuel;
- 281,100 tonnes of automotive gasoline;
- 164,320 tonnes of fuel oil;
- 14,700 tonnes of gas oil.
In 2025, the company's shipments did not include diesel fuel and gas oil. The cargo flow consisted only of automotive gasoline — 112,616 tonnes and fuel oil — 40,625 tonnes.
Consequently, the reduction in total volume was accompanied by the actual loss of major diesel shipments, which in 2024 formed more than half of the company's cargo base.
The reasons for this change cannot be established from railway documents. It could be related to the redistribution of cargo between senders and freight forwarders, changes in commercial contracts, or a general reduction in specific export directions. However, the 2025 volume represented only a small part of the company's previous petroleum product flow.
Shipments in 2025
All 153,241 tonnes were directed through Russian port stations of the Oktyabrskaya railway; there were no separate direct deliveries to Russian recipients.
The basis of shipments was unleaded automotive gasoline — 112,616 tonnes in 2,011 railcars, or 73.5% of the tonnage. Another 40,625 tonnes in 625 railcars accounted for fuel oil — 26.5%.
132,896 tonnes, or 86.7% of the total volume, were dispatched from Vitebsk station: all automotive gasoline and 20,280 tonnes of fuel oil. 20,345 tonnes of fuel oil arrived from Novopolotsk station.
However, the departure station only reflects the starting point of the railway transportation. It does not unequivocally determine the enterprise that produced the cargo.
132,961 tonnes, or 86.8% of the total volume, were directed to Luzhskaya station (exp.). The remaining 20,280 tonnes arrived at Avtovo station (exp.) in St. Petersburg.
The largest recipient was LLC Portenergo. 112,616 tonnes of automotive gasoline, or 73.5% of the company's total tonnage, were sent to it via Luzhskaya.
Portenergo is an operator of a complex for transshipment of liquefied petroleum gases and light petroleum products for export in the Ust-Luga seaport. Therefore, the company acted not as the final consumer of gasoline, but as an intermediate link between railway and sea transport.
20,345 tonnes of fuel oil arrived at JSC Ust-Luga Oil from Novopolotsk station. The company owns an oil product terminal that transships dark and light petroleum products from railway tank cars to sea tankers.
Another 20,280 tonnes of fuel oil were delivered via Avtovo station to JSC Petersburg Oil Terminal. The terminal receives liquid bulk cargo arriving by railway, provides for its storage, and further sea shipment.
All three recipients were operators of port infrastructure, not industrial consumers. The final destination countries of the petroleum products after sea transshipment have not been established.
In 2025, only a small part remained of the significantly larger cargo flow of the previous year. If in 2024 Logistic Energy was among the largest petroleum product shippers and transported over 1.2 million tonnes, in 2025 its volume decreased to 153.2 thousand tonnes.
At the same time, diesel fuel and gas oil supplies disappeared, and the remaining flow was concentrated at two port stations and three terminals. This indicates not only a quantitative decline but also a sharp reduction in the role of the company, which journalistic investigations link to Nikolai Vorobey's business circle, in the export logistics of Belarusian petroleum products.
1.7. Shipments of Liquefied Petroleum Gases
Shipments of liquefied petroleum gases and individual light hydrocarbon fractions form an independent segment of railway export. Goods are transported in specialized tank cars and containers. Oil refining and petrochemical enterprises, rolling stock operators, gas terminals, gas filling stations, and trading companies participate in the logistics chain.
In 2025, six consignors dispatched 3,013 railcars with liquefied petroleum gases and hydrocarbon fractions totaling 110,293 tonnes outside Belarus.
The main part of the products — 2,881 railcars and 106,597 tonnes — was transported in tank cars. Another 132 railcars transported 3,696 tonnes of LPG in large-capacity containers; this volume is included in the LPG product group.
| Consignor | Railcars | Mass, t | Share, % |
| RUP SG-Trans | 2,242 | 82,954 | 75.2% |
| LLC CHESS Bel | 396 | 14,652 | 13.3% |
| LLC Syrievye Resursy Bel | 233 | 7,433 | 6.7% |
| LLC NHTK Profit | 93 | 3,441 | 3.1% |
| LLC EKOIL Kimikl | 27 | 999 | 0.9% |
| LLC Zapadtransexpeditsiya | 22 | 814 | 0.7% |
| Total | 3,013 | 110,293 | 100% |
Thus, 88.5% of the tonnage under consideration was provided by two consignors — RUP SG-Trans and LLC CHESS Bel.
2,248 railcars and 83,176 tonnes, or 75.4% of the tonnage, went to the Russian Federation. 751 railcars with 26,599 tonnes of LPG, or 24.1%, were sent to Latvia. Another 14 railcars and 518 tonnes arrived at Kerch-Yuzhnaya station with the mark “exp.”.
The product structure included both commercial liquefied gases and specialized raw materials for the petrochemical industry.
| Cargo Name | Railcars | Mass, t | Share, % |
| Other liquefied petroleum gases in tank cars | 1,378 | 50,986 | 46.2% |
| LPG in large-capacity containers | 132 | 3,696 | 3.4% |
| Butylene-butadiene fraction | 1,026 | 37,962 | 34.4% |
| Propane-propylene fraction | 234 | 8,658 | 7.8% |
| Propylene fraction | 195 | 7,215 | 6.5% |
| Butane-butylene fraction | 48 | 1,776 | 1.6% |
| Total | 3,013 | 110,293 | 100% |
Commercial LPG, including containerized consignments, formed 54,682 tonnes, or 49.6% of the tonnage. Another 37,962 tonnes accounted for the butylene-butadiene fraction. Together, these two groups provided 84.0% of shipments.
This indicates a combination of two main types of supplies: commercial gas to distribution networks and hydrocarbon raw materials to petrochemical enterprises.
RUP SG-Trans
RUP SG-Trans became the largest consignor in the segment under consideration. The full name of the organization — Republican Unitary Enterprise for the Transportation and Supply of Liquefied Petroleum Gases — reflects its primary role as a specialized operator for LPG transportation and supply.
The enterprise has specialized rolling stock, including tank cars for LPG. Its role as a consignor on the waybill does not mean that it produced all the transported products.
In 2025, RUP SG-Trans dispatched 2,242 tank cars with a total mass of 82,954 tonnes. 56,129 tonnes were transported from Novopolotsk station, 26,048 tonnes from Barbarov station, and 777 tonnes from Rechytsa station.
The departure station shows the starting point of the railway transportation, but by itself does not determine the enterprise that manufactured the cargo.
A separate consignment of 14 railcars and 518 tonnes of LPG to Kerch-Yuzhnaya station for JSC Asian-European Gas Terminal was recorded. The shipment had the mark “exp.”, but the further direction of the cargo has not been established.
The destination station is located in occupied Crimea, so this route cannot be interpreted as a regular export through a Russian seaport.
Another 2,228 railcars and 82,436 tonnes were sent to the Russian Federation.
The largest direction was the Novopolotsk — Kombinatskaya route. Along this route, JSC Omsky Kauchuk received 1,165 railcars and 43,105 tonnes of products, including:
- 37,962 tonnes of butylene-butadiene fraction;
- 5,143 tonnes of propylene fraction.
This recipient accounted for 52.0% of RUP SG-Trans's tonnage. Omsky Kauchuk is a large petrochemical enterprise producing synthetic rubbers and organic synthesis products; the composition of supplies corresponds to the plant's raw material profile.
The next largest recipients were LLC Tekhnogaz — 7,511 tonnes, LLC LM Gaz — 5,439 tonnes, LLC Transgaz — 4,440 tonnes, and LLC Prayt Lyuks T — 2,701 tonnes.
Unlike Omsky Kauchuk, most of these organizations are involved in the reception, storage, wholesale trade, and further distribution of LPG. For example, LLC LM-Gaz indicates LPG supplies and the operation of a network of automotive gas filling stations.
A total of 51 recipient names are listed. The ten largest received 71,299 tonnes, or 85.9% of RUP SG-Trans's volume. The high concentration was primarily formed by the industrial route to Omsk, while the remaining supplies were distributed among regional gas companies, terminals, and gas filling stations.
In total, 65 railcars and 2,405 tonnes of LPG were sent to stations in the occupied territories of Ukraine: 14 railcars to Kerch-Yuzhnaya with the mark “exp.” and another 51 railcars to Simferopol-Gruzovoy, Dzhankoy, Inkerman II, and Kerch-Yuzhnaya stations.
These shipments are discussed in more detail in a separate publication by the Belarusian Railway Community.
LLC CHESS Bel
LLC CHESS Bel became the second largest LPG consignor. The open description of the company's activities indicates the reception of liquefied gases by railway transport, draining, storage, and operation of a tank farm.
Earlier technical materials also link the site to the processing of hydrocarbon raw materials. However, available sources do not allow asserting that all gas dispatched in 2025 was produced by the company itself.
From Vitba station, the enterprise dispatched 396 tank cars and 14,652 tonnes of LPG.
Eight railcars and 296 tonnes were sent to the Russian Federation. The sole recipient was LLC GNS Velikiye Luki.
The main part of LLC CHESS Bel's shipments went to Latvia. 388 railcars and 14,356 tonnes were sent to Daugavpils station:
- 350 railcars and 12,950 tonnes — consigned to SIA Intergaz;
- 38 railcars and 1,406 tonnes — consigned to SIA Euro Energo Company.
No media items found.
LLC Syrievye Resursy Bel
LLC Syrievye Resursy Bel is characterized in open industry sources as an organization providing freight forwarding services for LPG transport and the provision of railway rolling stock. No evidence of in-house gas production was found, so the company should be regarded primarily as a logistics operator and shipper.
In total, the enterprise dispatched from Vitba station 233 railcars with 7,433 tonnes of LPG.
101 tank cars accounted for 3,737 tonnes of gas. Another 132 railcars transported 3,696 tonnes of LPG in large-capacity containers.
No media items found.
12 railcars and 444 tonnes of LPG were dispatched to the Russian Federation. The consignee was LLC GNS Velikie Luki.
No media items found.
221 railcars with 6,989 tonnes of LPG proceeded in the Latvian direction.
89 tank cars and 3,293 tonnes of gas were dispatched to Daugavpils station consigned to Euro Energo Company.
Another 132 railcars with 3,696 tonnes of LPG in containers were dispatched consigned to OVI LTD:
- 130 railcars and 3,640 tonnes — to Mangali station marked “exp.”;
- two railcars and 56 tonnes — to Indra station marked “exp.”
OVI operates as a fuel wholesaler and terminal operator. Mangali and Indra stations may have been intermediate links, so the final consumer of the containerized LPG consignments has not been established.
No media items found.
LLC NHTK Profit
LLC NHTK Profit dispatched from Vitba station 93 railcars and 3,441 tonnes of LPG. The entire volume was directed to Daugavpils station:
- 87 railcars and 3,219 tonnes — consigned to SIA Intergaz;
- six railcars and 222 tonnes — consigned to Euro Energo Company.
According to available open information, the profile of LLC NHTK Profit could not be reliably established; in this article the company is characterized only as a shipper.
No media items found.
LLC ECOIL Chemical
LLC ECOIL Chemical dispatched from Vitba station to Daugavpils station 27 railcars and 999 tonnes of LPG. SIA Intergaz was the consignee of the entire volume.
No confirmation of in-house LPG production by the company was found in open sources. Available information points rather to a trading and intermediary profile of the organization.
No media items found.
LLC Zapadtransexpeditsiya
LLC Zapadtransexpeditsiya dispatched from Vitba station to Daugavpils station 22 railcars and 814 tonnes of LPG. Euro Energo Company was the consignee.
The company is engaged in freight forwarding and has infrastructure for transshipment, storage, and transportation of LPG and petroleum products. However, the company's own facility is located in Brest district, whereas the consignment in question was dispatched from Vitba station.
Therefore, the company's possession of processing and terminal infrastructure does not prove in-house production of this particular consignment.
No media items found.
Direct export of LPG to Latvia totaled 751 railcars and 26,599 tonnes.
The volume was distributed among three consignees:
- SIA Intergaz — 464 railcars and 17,168 tonnes, or 64.5%;
- Euro Energo Company — 155 railcars and 5,735 tonnes, or 21.6%;
- OVI LTD — 132 railcars and 3,696 tonnes, or 13.9%.
SIA Intergaz operates a liquefied gas receiving and storage terminal in Daugavpils and is engaged in its wholesale and retail sale. Euro Energo Company also operates in the field of wholesale fuel trade and terminal infrastructure operation. OVI LTD was the consignee of containerized LPG consignments directed to Mangali and Indra stations.
Latvian consignees represented the import, terminal, and distribution link; final consumers of the gas have not been established.
Overall, railway transport of LPG in 2025 had two main components. The first was a large industrial flow of hydrocarbon fractions from Novopolotsk consigned to Omsk Kauchuk. The second was deliveries of commercial LPG to regional gas companies, gas filling stations, trading organizations, and Latvian terminals.
The largest individual nodes were Kombinatskaya station, to which 43,105 tonnes were directed, and Daugavpils, which received 22,903 tonnes. Together they accounted for 66,008 tonnes, or 59.8% of the segment's tonnage.
The structure of the segment shows that a large industrial flow was combined with a network of terminals and trading and distribution companies. Therefore, the geography of railway consignees is broader than the geography of final gas consumption.
1.8. Transport of oils, lubricants, and other products
In 2025, railway transport of oils and lubricants totaled 3,305 railcars with a total mass of 204,754 tonnes. This category accounted for approximately 5.1% of the aggregate tonnage.
These volumes are already included in the totals of JSC Naftan and SE Belorusneft-Trans and are not added again to the enterprises' figures.
The category of oils and lubricants includes:
- petroleum oil — 2,772 railcars and 171,864 tonnes;
- other light mineral oils — 504 railcars and 31,248 tonnes;
- oil in large-capacity containers — 27 railcars and 1,512 tonnes;
- ECOS-B lubricant additive — one railcar and 68 tonnes;
- waste industrial and motor oils — one railcar and 62 tonnes.
Ordinary petroleum oil formed 83.9% of transport in this group, light mineral oils 15.3%, oils in containers 0.7%. Lubricant additive and waste oils together accounted for less than 0.1%.
The main flow was formed by two shippers from Novopolotsk. JSC Naftan dispatched 2,459 railcars and 152,458 tonnes, or 74.5% of the total volume. SE Belorusneft-Trans accounted for 789 railcars and 48,918 tonnes, or 23.9%. Another 57 railcars totaling 3,378 tonnes were dispatched by LLC Eurasia Lubricants.
| Shipper | Direction | Railcars | Mass, t |
| JSC Naftan | In the direction of the RF | 1,506 | 93,372 |
| JSC Naftan | Via Russian ports | 953 | 59,086 |
| SE Belorusneft-Trans | In the direction of the RF | 312 | 19,344 |
| SE Belorusneft-Trans | Via Russian ports | 477 | 29,574 |
| LLC Eurasia Lubricants | In the direction of the RF | 26 | 1,456 |
| LLC Eurasia Lubricants | Lithuania | 31 | 1,922 |
| Total | All directions | 3,305 | 204,754 |
114,172 tonnes of oils and lubricants, or 55.8% of the total volume, were dispatched in the direction of the Russian Federation. 88,660 tonnes, or 43.3%, passed through Russian export stations and terminals. Direct export to Lithuania totaled 1,922 tonnes — less than 1% of the oil flow. There were no deliveries of this product to Latvia.
The geography of transport was highly concentrated. Avtovo station accounted for 74,772 tonnes, Novorossiysk (exp.) for 62,868 tonnes, Predportovaya (exp.) for 21,142 tonnes. Together these three stations provided 77.6% of the total volume of oils and lubricants.
The largest consignee was LLC Kontur SPb — 1,206 railcars and 74,772 tonnes. The company operates a bunkering fleet and supplies vessels with fuel and oils in Russian ports. Therefore, this route reflects primarily the logistics and bunkering link, not necessarily the final consumption of the product.
Second place was taken by LLC Inmoreterminal, which received 961 railcars and 59,582 tonnes via Novorossiysk. The enterprise's main activity is storage and warehousing of oil and its refined products. Another 21,142 tonnes were directed to LLC Modul via Predportovaya — also to a terminal site performing loading, unloading, and cargo storage.
The three largest consignees accounted for 155,496 tonnes, or 75.9% of the oil flow. Such concentration characterizes primarily the transshipment and distribution system, not the structure of final consumption.
Among the consignees were also enterprises with a pronounced production profile. JSC Obninskorgsintsez received 109 railcars and 6,758 tonnes of petroleum oil; it produces automotive oils, lubricants, antifreeze, and other technical fluids. Another 1,866 tonnes of oil and lubricant additive were delivered to Lithuanian producer UAB SCT Lubricants.
Transport to Avtovo station consigned to LLC Kontur SPb is included in the direction of the Russian Federation. However, the profile of the bunkering operator allows for subsequent movement of the product, so the final consumer of this flow has not been established.
LLC Eurasia Lubricants
LLC Eurasia Lubricants is a Zaslavl-based producer of motor and industrial oils, greases, coolants, and other technical fluids. The enterprise produces products under the Favorit brand and has its own warehousing and logistics infrastructure.
In 2025, the company dispatched by railway transport 57 railcars totaling 3,378 tonnes of oils and lubricants. 31 railcars with 1,922 tonnes proceeded to Lithuania, 26 railcars with 1,456 tonnes of product to the Russian Federation.
The transport structure included:
- petroleum oil in tank cars — 29 railcars and 1,798 tonnes;
- oil in large-capacity containers — 27 railcars and 1,512 tonnes;
- ECOS-B lubricant additive — one railcar and 68 tonnes.
Petroleum oil in tank cars accounted for 53.2% of the company's volume, containerized oil transport for 44.8%, lubricant additive for 2%.
No media items found.
26 railcars with large-capacity containers, in which 1,456 tonnes of oil were transported, were dispatched to the Russian Federation. The entire volume proceeded to Blochnaya station on the Sverdlovsk Railway consigned to LLC BETTA.
Eighteen railcars transported 1,008 tonnes, another eight transported 448 tonnes: 56 tonnes per railcar.
LLC BETTA operates a container terminal in Perm at Blochnaya station and is engaged in receiving, storing, transshipping, and onward delivery of containers, including those with dangerous goods. The company is an intermediate logistics link; final Russian consumers of the oil have not been established.
For these 26 railcars, the specific station of dispatch is not indicated: only the country — Belarus — is designated. Therefore, the actual point of shipment formation cannot be determined.
No media items found.
Direct export to Lithuania totaled 31 railcars with a total mass of 1,922 tonnes. All shipments proceeded to Rimkai station.
The main volume — 30 railcars and 1,866 tonnes — was directed to CJSC SCT Lubricants, that is, Lithuanian UAB SCT Lubricants. It included:
- 29 tank cars with petroleum oil totaling 1,798 tonnes;
- one railcar with ECOS-B lubricant additive weighing 68 tonnes.
UAB SCT Lubricants is a producer of automotive oils, greases, and technical fluids in Klaipeda. The enterprise produces more than 500 types of oils, greases, and working fluids and has a tank farm for storing raw materials and products. The nature of the deliveries corresponds to its production profile, although the specific purpose of the petroleum oil has not been established.
Another railcar with a large-capacity container, in which 56 tonnes of oil were located, was dispatched from Shabany station consigned to UAB Atlantic Way. The company provides freight forwarding, warehousing, and customs services and is an intermediate logistics link.
Rimkai station is a freight station in Klaipeda. The presence of this station in the route does not in itself confirm onward maritime transport, so all 1,922 tonnes are counted as direct railway export to Lithuania, not as shipments via the Lithuanian port.
No media items found.
Other products
In addition to oils and lubricants, other products totaled 1,162 railcars with a total mass of 67,578 tonnes. This figure does not include containerized consignments of LPG and oil: they are already counted in the corresponding commodity groups.
| Category | Railcars | Mass, t | Share, % |
| Shippers' products in containers | 853 | 47,656 | 70.5% |
| Sulfuric acid | 303 | 19,586 | 29.0% |
| Other light petroleum products | 6 | 336 | 0.5% |
| Total | 1,162 | 67,578 | 100% |
The main volume of container transport fell to products of the Polymir plant — 766 railcars and 42,896 tonnes. Mozyr Refinery dispatched 85 railcars and 4,704 tonnes of products in containers, JSC Naftan — two railcars and 56 tonnes.
For these 853 railcars, the ETSNG code reflects the containerized method of delivery. Therefore, 47,656 tonnes are counted as products of the respective shippers in containers without more detailed commodity breakdown.
Another 132 railcars and 3,696 tonnes of containerized shipments by LLC Syrievye Resursy Bel are included in the LPG group, and 27 railcars and 1,512 tonnes by LLC Eurasia Lubricants in the oils group.
All sulfuric acid — 303 railcars and 19,586 tonnes — was dispatched by JSC Naftan. These shipments were oriented primarily to chemical industry enterprises and specialized logistics organizations in the Russian Federation.
Of 67,578 tonnes of other products, 62,426 tonnes were directed to the Russian Federation, another 5,152 tonnes passed through Russian export stations.
Oils and lubricants occupied a notable place in the commodity structure, but almost the entire flow was formed by JSC Naftan and SE Belorusneft-Trans. LLC Eurasia Lubricants provided a small but independent flow to the Russian Federation and Lithuania.
A significant part of the oil flow was delivered to terminal, warehousing, and bunkering operators. Therefore, destination stations and consignees reflect the last available railway link, but not always the final geography of product use.
1.9. Results for 2025 and comparison with 2024
Overall transport structure in 2025
By the end of 2025, the twelve enterprises and logistics organizations under review dispatched by railway transport 70,284 railcars of petroleum products, petrochemical products, liquefied petroleum gases, oils, and other related cargoes. Their aggregate mass totaled 4,043,441 tonnes.
The main part of transport was linked to Russian transport infrastructure: 2,587,446 tonnes, or 64.0%, passed through Russian ports, another 1,427,474 tonnes, or 35.3%, to destinations on the network of Russian railways.
99.3% of the tonnage was dispatched via Russian ports and in the direction of the Russian Federation. Direct routes to Latvia and Lithuania were preserved only in specialized segments: LPG was transported to Latvia, oils and lubricants to Lithuania. By scale they were not an alternative to Russian transport infrastructure.
High concentration was also maintained in the commodity structure. Gasolines accounted for 1,766,846 tonnes, or 43.7% of the total volume, fuel oil for 1,031,612 tonnes, or 25.5%. Together these two categories formed 69.2% of transport. Including diesel and jet fuel, as well as gas oil, the share of the three largest commodity groups reached 82.7%.
The structure of shippers was also concentrated. JSC Mozyr Refinery provided 59.3% of the tonnage, SE Belorusneft-Trans 18.2%, JSC Naftan 14.2%. The combined share of the three largest shippers totaled 91.7%.
Barbarov and Novopolotsk stations formed 95.9% of the mass of all dispatched cargoes. The October Railway accounted for 61.7% of the total tonnage. In the port segment, Avtovo (exp.) and Luzhskaya (exp.) stations provided 73.4% of transport, and the St. Petersburg Oil Terminal and Portenergo terminal received 72.6% of cargoes directed via Russian ports.
The export model simultaneously depended on two main production areas, several largest shippers, two railway-port directions, and a limited number of specialized terminals. Disruption of any of these links created risk for a significant part of the flow.
Overall dynamics of oil transport in 2024
To assess the changes preceding 2025, data from the previously published study “Analysis of freight transport of the Belarusian Railway in 2024: volumes, structure, and dynamics compared to 2023” are used.
In 2024, 11.43 million tonnes of oil and petroleum products were transported on the Belarusian Railway network versus 14.29 million tonnes the year before. The reduction totaled 2.86 million tonnes, or 20%.
The most substantial decline was observed precisely in the export and transit segments.
| Indicator | 2023, t | 2024, t | Change |
| All transport of oil and petroleum products on Belarusian Railway | 14,288,477 | 11,427,072 | −20.0% |
| Export from Belarus | 7,514,782 | 5,790,245 | −22.9% |
| Export in the Russian direction | 7,265,120 | 5,300,731 | −27.0% |
| Via Russian ports | 5,415,676 | 4,183,610 | −22.8% |
| Non-port destinations on the RZhD network | 1,849,444 | 1,117,121 | −39.6% |
In 2024, Russia provided 91.6% of all export of oil and petroleum products from Belarus. The year before, its share was 96.7%. The decline in share did not mean the Russian direction lost its dominant position, but showed that the decline in it was occurring faster than in some other export segments.
At the same time, within the Russian direction itself, the share of ports rose from 74.5 to 78.9%. This did not occur due to an increase in port transport: it also declined. The reason was that transport to other destinations on the network of Russian railways decreased even more sharply — by 39.6%.
Thus, already in 2024 three processes were observed simultaneously:
- overall reduction in export of oil and petroleum products;
- faster decline in transport to non-port destinations on the network of Russian railways;
- maintenance of high dependence on Russian ports.
Changes in commodity structure in 2024
The decline affected commodity groups unevenly.
| Commodity group | 2023, t | 2024, t | Change |
| Gasoline | 2,693,344 | 2,342,341 | −13.0% |
| Diesel fuel | 2,396,432 | 1,009,256 | −57.9% |
| Fuel oil | 1,088,646 | 1,301,757 | +19.6% |
| LPG | 245,999 | 361,953 | +47.1% |
| Oils and lubricants | 206,452 | 257,777 | +24.9% |
| Other light petroleum products | 339,744 | 70,836 | −79.2% |
The main factor in the reduction of export was diesel fuel. Its volume decreased by 1.39 million tonnes, or by 57.9%. This corresponded to 80.4% of the overall decline in export of oil and petroleum products from Belarus; calculated across all types of Belarusian Railway traffic, the same decline in diesel fuel explained 48.5% of the overall reduction in transport of this aggregated category.
At the same time, transport of fuel oil, LPG, and oils increased. Therefore, 2024 cannot be described only as a uniform decline in oil export. A restructuring of the commodity structure was occurring: diesel fuel and other light petroleum products were sharply declining, while certain heavy petroleum products and specialized cargoes remained more stable or growing.
In the transport of the twelve shippers for 2025, gasolines and fuel oil already provided 69.2% of the tonnage. This points to high dependence of the cargo flow on two mass commodity groups.
Russian ports and the geography of oil export in 2024
The total volume of export of all Belarusian cargoes via Russian ports in 2024 remained virtually unchanged: 14.00 million tonnes versus 14.06 million tonnes in 2023. The decline was only 0.4%.
However, the oil flow through these ports declined by 22.8% — from 5.42 million to 4.18 million tonnes. Its share in the overall port tonnage decreased from 38.5 to 29.9%.
Consequently, the almost unchanged overall figure for Russian ports concealed a serious decline in petroleum products. It was offset by growth in other cargoes, primarily potash fertilizers directed via the port of Bronka.
The distribution of petroleum products among Russian ports was as follows.
| Port Direction | 2023, t | 2024, t | Change |
| Seaport of St. Petersburg | 3,511,906 | 2,104,548 | −40.1% |
| Ust-Luga | 1,874,754 | 1,866,073 | −0.5% |
| Astrakhan Port | — | 185,587 | new direction |
| Novorossiysk Port | 6,445 | 23,866 | 3.7-fold increase |
| Seaport of Vyborg | 3,523 | 2,988 | −15.2% |
| Rostov Seaport | 19,048 | 398 | −97.9% |
| Port Olya | — | 150 | new direction |
St. Petersburg and Ust-Luga provided 94.9% of the oil flow through Russian ports. In 2023, their share reached 99.5%. The emergence of a noticeable flow through Astrakhan and the growth of Novorossiysk indicated the beginning of geographical diversification, but the new directions could not compensate for the reduction in St. Petersburg.
Monthly dynamics of port transportation in 2024
Ust-Luga's annual total almost coincided with the 2023 figure, but monthly statistics show that such stability was only external. In the second half of 2024, volumes began to decline rapidly.
Monthly indicators for Russian ports, in tonnes, show the following dynamics.
| Month | All Ports | St. Petersburg | Ust-Luga | Astrakhan |
| January | 511,832 | 277,306 | 229,183 | — |
| February | 476,522 | 227,950 | 243,837 | 3,838 |
| March | 441,855 | 197,584 | 229,900 | 14,142 |
| April | 334,896 | 197,828 | 127,264 | 9,804 |
| May | 436,422 | 252,985 | 166,811 | 15,811 |
| June | 502,341 | 242,822 | 242,157 | 17,362 |
| July | 341,507 | 193,723 | 128,180 | 10,361 |
| August | 225,176 | 95,249 | 123,668 | — |
| September | 214,821 | 143,423 | 55,742 | 12,676 |
| October | 235,684 | 109,075 | 96,768 | 28,668 |
| November | 206,430 | 72,121 | 98,442 | 35,637 |
| December | 256,227 | 94,381 | 124,122 | 37,490 |
In the first half of the year, 2.70 million tonnes of petroleum products passed through Russian ports, and 1.48 million tonnes in the second. The decrease between the half-years amounted to 45.3%. The average monthly volume decreased from approximately 451 thousand to 247 thousand tonnes.
For St. Petersburg, the second half of the year was 49.3% lower than the first, and for Ust-Luga — 49.4% lower. The Astrakhan direction, on the contrary, grew from 61 thousand tonnes in the first half to 125 thousand tonnes in the second.
Consequently, the decline in port exports did not begin in 2025. It became noticeable already in the second half of 2024. The southern and Caspian directions began to receive some cargo, but their increase was significantly less than the losses of the northwestern ports.
Comparison of port geography in 2024 and 2025
The indicators for 2024 and 2025 have different coverage. For 2024, all exports of the “oil and petroleum products” category were taken into account, while the calculation for 2025 covers twelve consignors and additionally includes petrochemistry and products in containers. Therefore, the comparison reflects the scale and direction of changes, but does not provide a strictly comparable year-on-year rate.
For a closer comparison, the port volume of goods with ETSNG oil codes was calculated separately: 2,582,294 tonnes in 2025 versus 4,183,610 tonnes in 2024. The calculated difference is 1.60 million tonnes, or 38.3%, but due to differences in coverage, it cannot be interpreted as an exact annual rate.
The following indicators provide only an approximate picture of changes in geography and are not an accurate assessment of the annual dynamics of all exports.
| Group of Directions | 2024, t | 2025, t | Change |
| St. Petersburg, Ust-Luga, and Vyborg | 3,973,609 | 1,927,929 | −51.5% |
| Southern and Caspian Ports | 210,001 | 654,365 | 3.1-fold increase |
Within this approximate comparison, the volume of the northwestern direction was approximately 2.05 million tonnes less. The volume of the southern and Caspian directions was approximately 444 thousand tonnes higher. This value corresponded to only 21.7% of the difference in the northwestern direction.
Within the same comparison, the share of St. Petersburg, Ust-Luga, and Vyborg decreased from approximately 95% to 74.7%. The share of the southern and Caspian directions, on the contrary, increased from 5% to 25.3%.
The comparison indicates a less one-sided port geography of the considered transportation in 2025, however, this change occurred mainly against the backdrop of a sharp reduction in previous routes. The growth of Astrakhan, Novorossiysk, and Makhachkala was not sufficient to restore the previous volume.
In addition, the decrease in geographical concentration did not eliminate dependence on individual terminals. Even after the redistribution of flows, Avtovo and Luzhskaya provided 73.4% of the port tonnage in 2025, and Petersburg Oil Terminal and “Portenergo” — 72.6%.
Comparison of one group of consignors
A more substantive comparison is provided by the publication on the export of Belarusian goods to Russia for nine months of 2024 mentioned below.
The comparison covers six consignors common to both periods:
- JSC “Mozyr Oil Refinery”;
- JSC “Naftan”;
- “Polymir” plant of JSC “Naftan”;
- LLC “Logistic Energy”;
- SE “Belarusneft-Trans”;
- RUP “SG-Trans”.
These six organizations provided 4,012,724 tonnes, or 99.2% of the total volume in 2025. However, nine months of 2024 are compared with the full year 2025, so the following discusses the intensity and structure of flows, not annual dynamics.
Average monthly intensity of six consignors, thousand tonnes
| Indicator | 9 months 2024 | 2025 | Change |
| All transportation | 484.7 | 334.4 | −31.0% |
| Through Russian ports | 392.2 | 215.6 | −45.0% |
| Directions on the Russian network | 92.5 | 118.8 | +28.4% |
The share of the port direction in the transportation of these six organizations decreased from 80.9% for January–September 2024 to 64.5% by the end of 2025. At the same time, the average monthly intensity of transportation to non-port destinations on the Russian network was 28.4% higher.
This ratio shows a decrease in the role of port transshipment and an increase in the role of destinations on the Russian network in the transportation structure of these six consignors. However, different observation periods do not allow measuring this shift as an exact annual dynamic.
Significant changes occurred at the level of individual consignors.
Even the entire volume of LLC “Logistic Energy” for 2025 — 153.2 thousand tonnes — was approximately seven times less than 1.077 million tonnes dispatched only for January–September 2024. The company's share in the group of six consignors decreased from 24.7% to 3.8%.
SE “Belarusneft-Trans” dispatched 734.4 thousand tonnes for the full year 2025, compared to 99.5 thousand tonnes for nine months of 2024. Its share in the group grew from 2.3% to 18.3%, and the second place after Mozyr Oil Refinery shifted from “Logistic Energy” to “Belarusneft-Trans”.
Mozyr Oil Refinery dispatched 2.563 million tonnes for nine months of 2024 and 2.398 million tonnes for the entire year 2025. The port volume amounted to 2.361 million and 1.766 million tonnes respectively, and the direction of Russian recipients — 201.8 thousand and 632.4 thousand tonnes. Despite the difference in periods, the flow structure noticeably shifted from ports to the Russian direction.
For JSC “Naftan”, the direction of Russian recipients amounted to 510.7 thousand tonnes for nine months of 2024 and 507.4 thousand tonnes for the entire year 2025. The port segment — 11.4 thousand and 68 thousand tonnes respectively; its share still remained significantly smaller than that of Mozyr Oil Refinery.
The full year 2025 for “Polymir” and “SG-Trans” exceeded their January–September 2024 level, but the cumulative contribution remained relatively small. “SG-Trans” transportation continued to be almost entirely oriented towards industrial and distribution recipients, rather than port transshipment.
The ratio of logistics operators changed significantly: the role of “Logistic Energy” decreased, while the volumes of “Belarusneft-Trans” grew. However, the growth of “Belarusneft-Trans” did not compensate for the overall reduction in port flow.
Comparable gasoline transportation for January–September
The most reliable comparison of identical periods is provided by the deliveries of motor gasoline from Mozyr Oil Refinery and LLC “Logistic Energy” to the “Portenergo” terminal via Luzhskaya station (exp.): here the period, cargo, station, and recipient coincide.
| Indicator | 9 months 2024 | 9 months 2025 | Change |
| Mozyr Oil Refinery — gasoline to “Portenergo” terminal, tonnes | 1,290,840 | 658,293 | −49.0% |
| LLC “Logistic Energy” — same route, tonnes | 281,100 | 112,616 | −59.9% |
For January–September, the flow from Mozyr Oil Refinery along this route decreased from 1,290,840 tonnes in 2024 to 658,293 tonnes in 2025, or by 49.0%. For “Logistic Energy”, the tonnage in the same direction decreased from 281,100 to 112,616 tonnes, or by 59.9%. This confirms that the decline in the northwestern port direction is not explained solely by the difference between annual and incomplete periods.
This dynamic was discussed in detail in the article “Gasoline exports from Belarus to third countries falling since early 2025, UAV attacks on Ust-Luga infrastructure exacerbate the situation”.
Key Outcomes
The results for 2025 should be viewed as a continuation of processes that became noticeable already in 2024.
Firstly, the reduction in oil exports began before the period under review. Already in 2024, its volume decreased by 22.9%, and in the second half of the year, oil shipments through Russian ports were 45.3% lower than in the first.
Secondly, the comparison shows a change in port geography. The volumes of St. Petersburg and Ust-Luga were significantly lower, while Astrakhan, Novorossiysk, and Makhachkala occupied a more prominent place. However, the increase in the total volume of these directions was significantly less than the difference in the northwestern direction.
Thirdly, the structure of transportation participants changed. The role of LLC “Logistic Energy” sharply decreased, while the importance of SE “Belarusneft-Trans” grew. Mozyr Oil Refinery maintained its dominant position, but part of its cargo flow shifted from ports to the direction of Russian recipients.
Fourth, the export model remained highly concentrated. Despite the growth of southern routes, the main part of the port traffic continued to depend on two stations and two terminal complexes. Direct routes to Latvia and Lithuania were of limited scale and could not serve as a full-fledged replacement for Russian Federation infrastructure.
Thus, 2025 was characterized not just by a reduction in individual export flows, but by a structural reorganization: a decrease in the northwestern port leg, an intensification of the direction towards Russian recipients, an increase in the role of southern routes, and a change in the ratio of logistics operators' volumes. At the same time, route and infrastructure dependence remained high.
Section II. Railway Export of Belarusian Petroleum Products and Petrochemicals in January–April 2026
2.1. Total Volume, Intensity, and Commodity Structure of Transportation
In January–April 2026, 34,941 railcars with a total mass of 2,025,757 tonnes were dispatched from the enterprises and commodity categories reviewed. For the first four months, the volume reached 50.1% of the total 2025 result.
Individual figures for January, February, March, and April are not separately identified in the available statistics. Therefore, it is impossible to reconstruct a consistent month-by-month dynamic within the period. To assess the intensity of transportation, the January–April result is compared with the average monthly figure for the full year 2025: the volume of four months is divided by four, and the annual volume of 2025 by twelve. This comparison shows the change in the current pace but is not a year-on-year assessment and does not account for seasonality.
Intensity and Main Transportation Directions
On average, 8,735 railcars and 506.4 thousand tonnes per month were dispatched in January–April. In 2025, the average monthly figure was 5,857 railcars and 337.0 thousand tonnes. Thus, the current intensity was 49.1% higher for railcars and 50.3% higher for tonnage.
The average cargo mass per railcar remained almost unchanged: 57.5 tonnes in 2025 and 58.0 tonnes in January–April 2026. Consequently, the higher average monthly tonnage in the first four months was primarily due to a larger number of cars, rather than a significant increase in their average load.
With a significantly higher average monthly intensity, the ratio of the two main directions remained almost unchanged. 1.301 million tonnes, or 64.2% of the total volume, passed through Russian ports to third countries; in the structure of transportation for the full year 2025, their share was 64.0%. Shipments to the Russian Federation accounted for 723.4 thousand tonnes, or 35.7%, compared to 35.3% at the end of 2025. In other words, the average monthly figures for both segments were higher than the 2025 average, but their overall proportion remained almost unchanged.
| Direction | Railcars | Mass, t | Share, % |
| Exports to Third Countries via Russian Ports | 21,744 | 1,300,896 | 64.2% |
| Shipments to the Russian Federation | 13,166 | 723,444 | 35.7% |
| Lithuania | 12 | 714 | 0.04% |
| Latvia | 19 | 703 | 0.03% |
| Total | 34,941 | 2,025,757 | 100% |
99.93% of the total tonnage passed through Russian ports or to recipients on the Russian railway network. Direct shipments to Latvia and Lithuania accounted for 1,417 tonnes, or 0.07%. Their combined average monthly intensity was 85.1% lower than the 2025 average. A small excess over the average level of shipments to Lithuania did not compensate for the significantly lower average monthly figure for the Latvian direction.
The railway route does not in all cases reveal the final market. In the direction of the Russian Federation, there are stations Luzhskaya, Avtovo, Novorossiysk, and other points with terminal and logistics recipients. Therefore, 35.7% cannot be entirely interpreted as internal Russian consumption.
Commodity Structure
| Cargo Group | Railcars | Mass, t | Share, % |
| Gasolines | 14,648 | 819,868 | 40.47% |
| Fuel Oil | 7,657 | 497,255 | 24.55% |
| Diesel and Jet Fuel | 5,941 | 367,534 | 18.14% |
| Oils and Lubricants | 2,224 | 137,688 | 6.80% |
| Petroleum Coke | 2,534 | 113,579 | 5.61% |
| LPG and Hydrocarbon Fractions | 1,098 | 40,626 | 2.01% |
| Shippers' Products in Containers | 580 | 32,480 | 1.60% |
| Petrochemical Products | 195 | 12,582 | 0.62% |
| Other Chemical Cargoes and Petroleum Products | 63 | 4,077 | 0.20% |
| Other Products of Eurasia Lubricants LLC | 1 | 68 | less than 0.01% |
| Total | 34,941 | 2,025,757 | 100% |
Gasolines, fuel oil, diesel, and jet fuel accounted for 1,684,657 tonnes, or 83.2% of transportation. Gasolines remained the largest group — 819.9 thousand tonnes, but their share decreased from 43.7% in 2025 to 40.5%. The combined share of gasolines and fuel oil decreased from 69.2% to 65.0%, as the average monthly volumes of diesel and jet fuel, as well as oils, were noticeably higher than the 2025 average.
On a monthly basis, the volume of diesel and jet fuel was 146.4% higher than the 2025 average. Gas oil, which was present in 2025 transportation, was not observed in January–April 2026. The average monthly volume of oils and lubricants was 101.7% higher.
Containerized shipments are accounted for by the shipper's profile. The oil group includes 1,400 tonnes of Eurasia Lubricants LLC products in containers. Separately shown are 31,920 tonnes of Polymir plant products, 392 tonnes of Mozyr Oil Refinery products, and 168 tonnes of Naftan products in containers. A narrower nomenclature for these batches is not established.
Largest Shippers
| Shipper | Mass, t | Share, % | Vs. 2025 Average |
| JSC Mozyr Oil Refinery | 1,013,638 | 50.04% | +26.8% |
| SE Belorusneft-Trans | 758,374 | 37.44% | +209.8% |
| JSC Naftan | 150,929 | 7.45% | −21.3% |
| RUE SG-Trans | 39,923 | 1.97% | +44.4% |
| Polymir Plant of JSC Naftan | 37,806 | 1.87% | +65.7% |
| Logistic Energy LLC | 22,718 | 1.12% | −55.5% |
| Eurasia Lubricants LLC | 1,666 | 0.08% | +48.0% |
| CHESS Bel LLC | 444 | 0.02% | −90.9% |
| NHTK Profit LLC | 259 | 0.01% | −77.4% |
Mozyr Oil Refinery and SE Belorusneft-Trans provided 87.5% of the total tonnage, and together with Naftan — 94.9%. Concentration increased: in 2025, the share of this trio was 91.7%.
However, the ratio within the trio changed fundamentally. The share of Mozyr Oil Refinery decreased from 59.3% to 50.0%, Naftan's from 14.2% to 7.4%, while the share of SE Belorusneft-Trans increased from 18.2% to 37.4%. This company accounted for about three-quarters of the difference between the combined average monthly figures of the two periods. Thus, the main part of the excess over the 2025 average was concentrated with one shipper — SE Belorusneft-Trans.
Raw Materials Bel LLC, ECOIL Chemical LLC, and Zaptransexpedition LLC were among the shippers in 2025, but their shipments are not represented in January–April 2026. This alone does not confirm the cessation of transportation or a sustained reduction in the number of participants.
Geography of Transportation and Port Hubs
1,297,888 tonnes of cargo were formed at Barbarov station, and 725,500 tonnes at Novopolotsk station. Together, the two main departure points provided 99.9% of transportation, compared to 95.9% in 2025. This means that a higher average monthly volume was accompanied by an even greater concentration at Belarus's two oil refining hubs.
The Oktyabrskaya Railway accounted for 1,104,614 tonnes, or 54.5% of the total volume. The Privolzhskaya Railway received 431,728 tonnes, the Moskovskaya Railway — 206,482 tonnes, and the Severo-Kavkazskaya Railway — 135,229 tonnes. The share of the first four railways reached 92.7%. Compared to 2025, the share of the Oktyabrskaya Railway decreased from 61.7% to 54.5%, while the Privolzhskaya Railway, on the contrary, increased from 14.4% to 21.3%.
Port traffic was concentrated at four stations: Avtovo — 626,850 tonnes, Trusovo — 259,878 tonnes, Luzhskaya — 184,800 tonnes, and Novolesnaya — 167,828 tonnes. They accounted for 95.3% of transportation through Russian export stations. The four largest recipients — Petersburg Oil Terminal, Terminal Ilyinka, Portenergo, and Transoil Terminal — accumulated 94.6% of the port tonnage.
Behind the outwardly stable share of the port direction lay a noticeable reorganization of routes. On a monthly basis, transportation through Avtovo was 97.5% higher than the 2025 average, through Trusovo — 123.3% higher, and through Novolesnaya — 145.8% higher. At the same time, the average monthly flow through Luzhskaya with an export mark was 41.5% lower. This is a redistribution of railway assignments within the Russian port network; it does not in itself reveal the reasons for changes in routes and further sea directions.
2.2. JSC Mozyr Oil Refinery
Mozyr Oil Refinery maintained its position as the largest shipper. In January–April 2026, 16,727 railcars with a total mass of 1,013,638 tonnes were dispatched from Barbarov station — half of the total tonnage reviewed.
On average, the enterprise dispatched 253.4 thousand tonnes per month, compared to 199.9 thousand tonnes in 2025. The average monthly intensity was 26.8% higher in tonnage and 26.1% higher in number of cars. However, the excess over the average level was concentrated primarily in the port segment.
| Direction | Railcars | Mass, t | Share, % |
| Exports to Third Countries via Russian Ports | 12,912 | 796,986 | 78.6% |
| Shipments to the Russian Federation | 3,815 | 216,652 | 21.4% |
| Total | 16,727 | 1,013,638 | 100% |
The share of port assignments increased from 73.6% in 2025 to 78.6%. Shipments to the Russian Federation practically maintained their previous average monthly level, so the change in the enterprise's structure was primarily due to a higher average monthly intensity of exports through terminals.
| Cargo | Mass, t | Share, % |
| Fuel Oil | 451,158 | 44.5% |
| Motor Gasoline | 409,258 | 40.4% |
| Diesel Fuel | 144,206 | 14.2% |
| Benzene | 7,280 | 0.7% |
| Other Gasolines | 1,344 | 0.1% |
| Enterprise Products in Containers | 392 | less than 0.1% |
Fuel oil and motor gasoline accounted for 84.9% of the enterprise's transportation. The average monthly volume of fuel oil was 37.8% higher than the 2025 average, and gasoline — 8.9% higher. The largest excess was observed for diesel fuel: its intensity was 2.75 times as high as the 2025 average. Gas oil and raw materials for carbon black production, which were present in 2025 transportation, were not observed in January–April.
No media items found.
Exports to Third Countries via Russian Ports
796,986 tonnes of Mozyr Oil Refinery products were directed through Russian export stations. Avtovo station remained the key hub: it accounted for 605,026 tonnes, or 75.9% of the port flow. Petersburg Oil Terminal received 601,666 tonnes of fuel oil, diesel fuel, and gasoline.
82,096 tonnes of gasoline were sent to Luzhskaya station for Portenergo LLC. 76,720 tonnes passed through Trusovo to Terminal Ilyinka, and 33,144 tonnes through Novolesnaya to Transoil Terminal. The three largest terminal recipients concentrated 95.4% of the enterprise's port volume.
The average monthly fuel oil flow to PNT was 52.4% higher than the 2025 average. The difference in diesel fuel shipments in the same direction was particularly noticeable — 30.9 thousand vs. 1.2 thousand tonnes on average per month. At the same time, the average monthly gasoline flow to Portenergo was 68.4% lower. Gasoline transportation through Trusovo and Novolesnaya was higher than the 2025 average, and a separate gasoline flow to PNT amounted to 35,840 tonnes over four months.
Thus, the higher average monthly port volume of Mozyr Oil Refinery was not due to an expansion of geography, but to a change in the distribution of petroleum products among several terminals. Almost 60% of the enterprise's total volume passed through Avtovo with an export mark, which increased dependence on a single railway hub.
No media items found.
Shipments to the Russian Federation
216,652 tonnes of products were shipped to the Russian Federation. Motor gasoline accounted for 185,538 tonnes, or 85.6% of this flow. Unlike the port segment, shipments were distributed among a larger number of stations, oil sales organizations, terminals, and industrial recipients.
The largest recipients were LUKOIL-Yugnefteprodukt LLC — 39,312 tonnes and Gazprom AZS Network LLC — 33,600 tonnes. These were followed by Energetik LLC — 12,376 tonnes, Neftika LLC — 9,798 tonnes, TES Terminal 1 LLC — 7,748 tonnes, and Shchekinoazot Trading House — 7,280 tonnes of benzene. The three largest recipients provided only 39.4% of the direction, which is significantly lower than the concentration at port terminals.
Some cargo followed the Crimean, Donetsk, and Luhansk railways. These routes are included in the enterprise's overall figures and, as noted in the introduction, are not considered separately in this material.
As a result, Mozyr Oil Refinery's logistics model became even more contrasting: a rapidly growing and highly concentrated terminal flow was combined with a relatively stable and more diversified supply network towards the Russian Federation.
No media items found.
2.3. JSC Naftan
JSC Naftan in January–April 2026 dispatched from Novopolotsk station 2,784 railcars with a total mass of 150,929 tonnes. The enterprise accounted for 7.4% of the total tonnage, compared to 14.2% in 2025.
The average monthly volume was 21.3% lower than the 2025 average, and the number of cars was 22.4% lower. Shipments to the Russian Federation were most noticeably below average — by 26.3%. The average monthly port flow, on the contrary, was 16.1% higher, so its share rose from 11.8% to 17.4%.
| Direction | Railcars | Mass, t | Share, % |
| Shipments to the Russian Federation | 2,307 | 124,619 | 82.6% |
| Exports to Third Countries via Russian Ports | 477 | 26,310 | 17.4% |
| Total | 2,784 | 150,929 | 100% |
Commodity Structure
| Cargo | Mass, t | Share, % |
| Petroleum Anode Coke | 55,754 | 36.9% |
| Petroleum Oils | 42,594 | 28.2% |
| Fuel Oil | 22,476 | 14.9% |
| Jet Fuel | 20,956 | 13.9% |
| Sulfuric Acid | 3,965 | 2.6% |
| Industrial Gasoline | 3,864 | 2.6% |
| Other Products | 1,320 | 0.9% |
Coke and petroleum oils accounted for 65.1% of Naftan's transportation. On a monthly basis, coke shipments were 29.0% lower than the 2025 average, oils — 16.0% lower, and sulfuric acid — 39.3% lower. At the same time, the volume of fuel oil was more than nine times higher than the low base, and jet fuel — 12.5% higher. The difference between the periods was not uniform across commodity items.
No media items found.
Exports to Third Countries via Russian Ports
Naftan's port flow amounted to 26,310 tonnes. Novorossiysk accounted for 22,170 tonnes: Inmorterminal LLC received 17,670 tonnes of petroleum oil, Ruscon LLC — 4,500 tonnes of anode coke. Another 4,140 tonnes of coke were sent to Modul LLC at Predportovaya station.
All three recipients perform terminal or container-logistics functions. The growth in the port share therefore reflects an increase in the transshipment direction, but does not reveal the final country and actual buyer of the products.
No media items found.
Shipments to the Russian Federation
The largest railway recipient was Ultramar LLC — 46,845 tonnes of anode coke at Luzhskaya station. The company is a sea transshipment terminal, so this flow cannot automatically be considered internal industrial consumption. Contour SPb LLC received 20,380 tonnes of oils and fuel oil at Avtovo station, NV Bunker LLC — 12,414 tonnes at Frezerny station.
A separate group was formed by aviation fuel infrastructure. Sovex LLC received 10,140 tonnes of jet fuel at Predportovaya station; smaller batches were sent to airport fuel supply operators. Industrial recipients included manufacturers of lubricants and chemical products.
The largest recipient accounted for 31.0% of Naftan's volume, the three largest — 56.3%, and five — 71.2%. Concentration was lower than in the port segment, but significantly higher than for Mozyr Oil Refinery's Russian direction.
The decrease in total volume was not uniform across all routes. In January–April 2026, a number of large chains present in 2025 were not observed. In particular, there were no shipments of anode coke to Novotrans Aktiv LLC, which amounted to 113,005 tonnes in 2025. At the same time, average monthly coke shipments to Ultramar were 33.6% higher than the 2025 average, jet fuel to Sovex — 99.6% higher, and oil to Contour SPb — 62.4% lower.
Thus, in the first four months of 2026, the composition of Naftan's commodity and route chains changed significantly. With a lower total volume, the share of port assignments and individual terminals increased. The absence of shipments for four months does not yet mean that these chains have ceased.
No media items found.
2.4. Polymir Plant of JSC Naftan
The Polymir plant dispatched 666 railcars with a total mass of 37,806 tonnes from Novopolotsk station. On average per month, the volume was 65.7% higher than the 2025 average monthly level, and the number of cars was 68.2% higher.
30,750 tonnes, or 81.3% of the enterprise's transportation, went to the Russian Federation. 7,056 tonnes, or 18.7%, were sent through a Russian port. The average monthly port rate was 4.1 times as high as the 2025 average, and its share more than doubled.
| Cargo | Mass, t | Share, % |
| Polymir Products in Containers | 31,920 | 84.4% |
| Petroleum Pyrocondensate | 2,640 | 7.0% |
| Industrial Gasoline | 1,624 | 4.3% |
| Acrylonitrile | 1,160 | 3.1% |
| Petroleum Pyrobenzene | 462 | 1.2% |
The main source of the higher average monthly volume was the enterprise's products in containers: they accounted for 84.4% of the tonnage, and the intensity of such shipments was 123.2% higher than the 2025 average. The container method of transportation does not allow for determining the specific nomenclature of the batch, so it is not referred to as polyethylene or another individual product in the article.
No media items found.
Exports to Third Countries via Russian Ports
The entire port flow — 126 railcars and 7,056 tonnes of products in containers — was directed to Novorossiysk station for Novomorsnab LLC. The company operates as a port expediter and container terminal, meaning it represents a logistics, not a final production, link.
On average per month, this route was almost five times larger than in 2025. The higher average monthly volume of the Novorossiysk direction became one of the main reasons for the increase in Polymir's port share.
No media items found.
Shipments to the Russian Federation
The largest destination stations were Mamlyutka — 9,268 tonnes, Bazaiha — 7,952 tonnes, Lena — 5,712 tonnes, Chepetskaya — 2,688 tonnes, and Kurya — 1,568 tonnes. These five points accounted for 88.4% of shipments to the Russian Federation.
Mamlyutka station belongs to the Petropavlovsk branch of the South Ural Railway, but is geographically located in the North Kazakhstan region of Kazakhstan. Therefore, transportation to it is retained in the Russian direction by railway affiliation. Over four months, more products were sent there than in the entire year 2025: 9,268 vs. 8,816 tonnes.
Recipients included a combination of transport operators, trading organizations, and industrial companies. The largest recipient was Megapolis Systems — 9,268 tonnes; the company's profile is related to wholesale trade in chemical products. Neftekhimicheskaya Transportnaya Kompaniya LLC, which received 7,952 tonnes at Bazaiha station, acts as a railway operator.
Cresol NefteService LLC received 5,712 tonnes at Lena station; the enterprise produces chemical reagents for the oil and gas industry. GaloPolymer Kirovo-Chepetsk LLC received 2,688 tonnes and is a major producer of fluoropolymer products. However, the recipient's profile does not reveal the content of each containerized batch and should not be used for such attribution.
Megapolis Systems accounted for 24.5% of the total volume, the three largest companies — 64.2%, and five — 86.4%. 6,496 tonnes of products in containers, 2,640 tonnes of pyrocondensate, and 132 tonnes of pyrobenzene were sent to Mamlyutka, so the higher volume of this station cannot be attributed solely to containerized batches. The enterprise's overall result was formed by a higher average monthly intensity of container shipments to Mamlyutka and Novorossiysk, as well as a new container flow to Lena station — 5,712 tonnes.
In January–April 2026, Polymir primarily strengthened the container model for product export. The geography of recipients expanded the possibilities for cargo distribution, but the high share of operators, terminals, and trading companies still does not allow for identifying all final consumers.
No media items found.
2.5. SE Belorusneft-Trans
SE Belorusneft-Trans became the main source of the higher combined average monthly volume at the beginning of 2026. Over four months, the company dispatched 13,251 railcars with a total mass of 758,374 tonnes — already 3.3% more than for the entire year 2025.
The average monthly intensity was 3.1 times as high as the 2025 average. This company accounted for about 75.8% of the difference between the combined average monthly figures of the two periods. As a result, its share in the total tonnage rose from 18.2% to 37.4%, approaching the figure for Mozyr Oil Refinery.
| Direction | Railcars | Mass, t | Share, % |
| Exports to Third Countries via Russian Ports | 7,844 | 447,826 | 59.1% |
| Shipments to the Russian Federation | 5,407 | 310,548 | 40.9% |
| Total | 13,251 | 758,374 | 100% |
The average monthly volume through Russian ports was 2.26 times as high as the 2025 average, or 125.9% higher, and for directions on the Russian network — 6.67 times higher, or 566.9% higher. Therefore, the share of the port segment decreased from 81.0% to 59.1%, although the intensity of port transportation was more than twice as high as the 2025 average.
| Cargo | Mass, t | Share, % |
| Motor Gasoline | 393,026 | 51.8% |
| Diesel Fuel | 190,406 | 25.1% |
| Petroleum Oils | 74,462 | 9.8% |
| Petroleum Anode Coke | 57,825 | 7.6% |
| Fuel Oil | 23,621 | 3.1% |
| Light Mineral Oils | 19,034 | 2.5% |
Gasoline and diesel fuel accounted for 76.9% of the company's transportation. On a monthly basis, the gasoline flow was 2.46 times as high as the 2025 average, diesel — 3.43 times higher, anode coke — almost six times higher, petroleum oils — 12.5 times higher. The excess over the average level covered all main nomenclature but was especially noticeable in the oil and coke segments.
489,812 tonnes, or 64.6% of the volume, were dispatched from Novopolotsk; 268,562 tonnes from Barbarov. SE Belorusneft-Trans acted as the shipper for these batches; this does not mean that the company produced the entire transported volume.
No media items found.
Exports to Third Countries via Russian Ports
Trusovo station became the largest port direction: Terminal Ilyinka LLC received 183,158 tonnes. 134,684 tonnes arrived at Novolesnaya for Transoil Terminal LLC, and 102,704 tonnes at Luzhskaya for Portenergo LLC. The three recipients concentrated 93.9% of the company's port flow.
Significantly smaller batches followed through Novorossiysk — 10,044 tonnes, Avtovo — 9,858 tonnes, and Predportovaya — 6,758 tonnes. The share of the largest port recipient decreased from 50.5% in 2025 to 40.9% in January–April 2026. Together, Terminal Ilyinka, Transoil Terminal, and Portenergo concentrated 93.9% of the port flow. Dependence was redistributed among three hubs, but concentration remained high.
The gasoline routes Barbarov — Trusovo — Terminal Ilyinka and Novopolotsk — Luzhskaya — Portenergo were most noticeably higher than the 2025 average. Shipments of gasoline and diesel fuel through Novolesnaya were also above average. This redistribution became one of the factors in the overall growth of the Privolzhskaya Railway in the transportation structure.
No media items found.
Shipments to the Russian Federation
Shipments to the Russian Federation amounted to 310,548 tonnes. Unlike the highly concentrated port segment, they were distributed among a larger number of stations and recipients. The largest recipient accounted for less than 10% of this volume, and the three largest — about 24%.
The largest recipient was Ultramar LLC — 30,780 tonnes of anode coke. Gazprom AZS Network LLC received 22,866 tonnes of petroleum products, Gazpromneft-Terminal SPb LLC — 21,018 tonnes of oils, Cargo LLC — 18,360 tonnes of coke, LUKOIL-Severo-Zapadnefteprodukt LLC — 16,466 tonnes, Contour SPb LLC — 15,934 tonnes.
Recipients included sales networks, oil depots, bunkering companies, industrial enterprises, and terminals. Of 57,825 tonnes of anode coke, at least 39,465 tonnes were addressed to confirmed terminal recipients — Ultramar and Novorossiysk Commercial Sea Port. Another 18,360 tonnes were received by Cargo LLC, whose functional profile cannot be reliably determined by a single item. Therefore, the entire volume cannot be interpreted as internal industrial consumption.
Part of the transportation fell on the Crimean, Donetsk, and Luhansk railways. In accordance with the scope of the study, these routes are included in the total tonnage and are not considered separately here.
The result of SE Belorusneft-Trans became the main structural change at the beginning of 2026: the company's average monthly figures were higher in both the port segment and for directions on the Russian network. The excess over the average level was not limited to one cargo or one terminal and affected both departure stations — Novopolotsk and Barbarov.
No media items found.
2.6. Logistic Energy LLC
Logistic Energy LLC dispatched 385 railcars with a total mass of 22,718 tonnes in January–April 2026. The entire volume originated from Novopolotsk through Russian export stations. No shipments to the Russian Federation, Latvia, or Lithuania were observed.
The average monthly tonnage was 55.5% lower than the 2025 average, and the number of cars was 56.2% lower. This continued the trend observed for the company when comparing the same gasoline route for January–September 2024 and 2025.
The commodity and route structure, however, changed significantly. Diesel fuel accounted for 193 railcars and 11,966 tonnes. It was directed to Avtovo station (exp.) for Petersburg Oil Terminal. Another 192 railcars with 10,752 tonnes of gasoline passed through Kola station (exp.) for Pervy Murmansky Terminal LLC.
In the data available to the Community, this Murmansk direction is recorded for the first time. For this route, 192 railcars with 10,752 tonnes of gasoline were sent via Kola station (exp.) to Pervy Murmansky Terminal LLC. It expanded the geography of Russian port assignments beyond St. Petersburg and the Leningrad region. Further movement of products after arrival at the terminal is not disclosed by railway information.
No media items found.
In 2025, 112,616 tonnes of gasoline followed the Vitebsk — Luzhskaya (exp.) — Portenergo chain. The fuel oil flow was almost equally divided: 20,280 tonnes were sent via the Vitebsk — Avtovo (exp.) — PNT route, and another 20,345 tonnes via the Novopolotsk — Luzhskaya (exp.) — Ust-Luga Oil route. In January–April 2026, none of these complete chains were repeated.
In the first four months of 2026, the company's railway scheme changed significantly. The average monthly volume of the new route through Kola — 2,688 tonnes — was 71.4% lower than the average monthly gasoline flow through Luzhskaya to Portenergo in 2025, which was 9,385 tonnes.
No media items found.
2.7. Transportation of Liquefied Petroleum Gases
In January–April 2026, the transportation of liquefied petroleum gases and related fractions amounted to 1,098 railcars and 40,626 tonnes. On average per month, the tonnage was 10.5% higher than the 2025 average, and the number of cars was 9.3% higher.
| Shipper | Railcars | Mass, t | Share, % |
| RUE SG-Trans | 1,079 | 39,923 | 98.27% |
| CHESS Bel LLC | 12 | 444 | 1.09% |
| NHTK Profit LLC | 7 | 259 | 0.64% |
| Total | 1,098 | 40,626 | 100% |
Commodity Structure
| Cargo | Railcars | Mass, t | Share, % |
| Other Liquefied Petroleum Gases | 443 | 16,391 | 40.35% |
| Butylene-Butadiene Fraction | 391 | 14,467 | 35.61% |
| Propylene Fraction | 136 | 5,032 | 12.39% |
| Propane-Propylene Fraction | 128 | 4,736 | 11.66% |
Almost the entire segment was concentrated with one shipper. The share of RUE SG-Trans increased from approximately 75.2% in 2025 to 98.3%. The company's average monthly volume was 44.4% higher than the 2025 average, while for CHESS Bel LLC it was 90.9% lower, and for NHTK Profit LLC — 77.4% lower.
No media items found.
RUE SG-Trans Shipments to the Russian Federation
All 39,923 tonnes dispatched by RUE SG-Trans were destined for the Russian Federation. 24,235 tonnes were sent from Novopolotsk, and 15,688 tonnes from Barbarov. Transportation was distributed among petrochemical enterprises, gas companies, storage facilities, and logistics operators.
The largest recipient was Omsk Kauchuk JSC — 17,205 tonnes of butylene-butadiene and propylene fractions at Kombinatskaya station. This is a large petrochemical enterprise that uses hydrocarbon raw materials in the production of synthetic rubbers and other products.
LLC Tekhnogaz received 6,401 tonnes at Beryozki station, LLC Gazpromneft Logistika received 2,294 tonnes at Yanichkino station. LLC Transgaz and LLC LM Gaz each received 1,813 tonnes, and LLC Lgov Gaz received an additional 1,739 tonnes. With the exception of Omsk Kauchuk, the largest consignees were predominantly engaged in gas trading, storage, and distribution logistics.
Omsk Kauchuk accounted for 43.1% of the tonnage dispatched by RUE SG-Trans, the two largest consignees accounted for 59.1%, and the top five accounted for 74.0%. Concentration was high not only by shipper: nearly three-quarters of the tonnage was received by five consignees.
No media items found.
Direct shipments to Latvia
19 railcars totaling 703 tonnes of LPG were dispatched to Latvia. The entire volume traveled from Vitba station to Daugavpils station consigned to SIA Intergaz: LLC CHESS Bel dispatched 444 tonnes, and LLC NKHTK Profit dispatched 259 tonnes. There were no LPG shipments via Russian ports during the period under review.
For comparison, in 2025 the direct Latvian LPG flow totaled 26,599 tonnes and included shipments from five shippers. On a monthly basis, the volume for early 2026 was 92.1% lower. Shipments from LLC Syryevye Resursy Bel, LLC EKOYIL Kimikl, and LLC Zapadtransekspeditsiya are not represented in January–April 2026.
No media items found.
The average monthly volume of the LPG segment was moderately above the 2025 average; however, its structure became significantly narrower. The entire difference between the periods was attributable to RUE SG-Trans, whereas average monthly direct shipments to Latvia were 92.1% lower, and the share of a single shipper reached 98.3%.
2.8. Shipments of oils, lubricants, and other products
Shipments of oils and lubricants in January–April 2026 totaled 2,224 railcars with a combined mass of 137,688 tonnes. On a monthly basis, tonnage was 101.7% above the 2025 average, and the number of railcars was 101.9% above.
| Shipper | Railcars | Mass, t | Share, % |
| SE Belorusneft-Trans | 1,508 | 93,496 | 67.90% |
| JSC Naftan | 687 | 42,594 | 30.94% |
| LLC Eurasia Lubricants | 29 | 1,598 | 1.16% |
| Total | 2,224 | 137,688 | 100% |
Product structure
| Product | Railcars | Mass, t | Share, % |
| Petroleum oils | 1,888 | 117,056 | 85.02% |
| Light mineral oils | 307 | 19,034 | 13.82% |
| Eurasia Lubricants oils in containers | 26 | 1,400 | 1.02% |
| EKOS-B lubricant additive | 3 | 198 | 0.14% |
The primary source of the higher average monthly volume was SE Belorusneft-Trans: its oil shipments were 5.7 times as high as the 2025 average. Naftan, by contrast, was 16.2% lower. The two companies accounted for 98.8% of the segment, so the nearly twofold increase over the average level primarily reflects the shipments of a single shipper.
92,092 tonnes of oils were dispatched in the direction of the Russian Federation, 44,950 tonnes via Russian export stations, and 646 tonnes directly to Lithuania. The largest nodes were Avtovo without export marking—27,776 tonnes, Novorossiysk with export marking—27,714 tonnes, and Novy Port—21,204 tonnes.
Among consignees, LLC Inmortterminal stood out with 26,226 tonnes, LLC Kontur SPb with 24,614 tonnes, and LLC Gazpromneft-Terminal SPb with 21,018 tonnes. Three companies accounted for 52.2% of oil shipments. A significant portion of consignees performed terminal, bunkering, or logistics functions, so the railway consignee was not always the final purchaser of the product.
LLC Eurasia Lubricants
LLC Eurasia Lubricants dispatched 30 railcars totaling 1,666 tonnes. The oil segment includes 29 railcars and 1,598 tonnes: 1,400 tonnes of oils in containers and 198 tonnes of EKOS-B lubricant additive. An additional railcar of 68 tonnes is designated as other products of the company and is not included in the oil volume.
No media items found.
18 railcars with 952 tonnes of oils in containers traveled in the direction of the Russian Federation—to Igumnovo station consigned to LLC Neftekhimicheskaya Transportnaya Kompaniya. The point of origin is indicated generically as “Belarus,” without a specific station.
No media items found.
12 railcars totaling 714 tonnes of products were dispatched to Lithuania. Oils accounted for 11 railcars and 646 tonnes: 392 tonnes of oils in containers were dispatched to CJSC Atlantic Vai at Rimkai station, an additional 56 tonnes to the same consignee at Draugiste station, and 198 tonnes of EKOS-B additive to CJSC SCT Lubricants at Rimkai station. Separately, 68 tonnes of other products were dispatched to CJSC SCT Lubricants.
No media items found.
In addition to oils, 3,965 tonnes of sulfuric acid, 112 tonnes of other light petroleum products, and 68 tonnes of other products from LLC Eurasia Lubricants were transported. Containerized consignments from Mozyr Refinery, Naftan, and Polimir are accounted as products of the respective shippers; they are not included in the oil segment.
The main feature was the nearly twofold higher average monthly volume of oil shipments, provided by SE Belorusneft-Trans. At the same time, the small direct Lithuanian flow persisted but accounted for less than half a percent of oil tonnage.
2.9. Results for January–April 2026
In the first four months of 2026, the volume of railway transport of the petroleum products and petrochemical products under review reached 2.026 million tonnes—half the result for all of 2025. Average monthly intensity was 50.3% higher than the 2025 average by tonnage and 49.1% higher by number of railcars. However, behind the overall increase over the average level were divergent processes.
First, the overall ratio of directions remained virtually unchanged. Port destinations retained a share of approximately 64%, shipments in the direction of the Russian Federation approximately 36%. 99.93% of tonnage passed through the Russian network and port nodes, demonstrating nearly complete concentration of the routes under review on this infrastructure.
Second, the structure of shippers changed sharply. SE Belorusneft-Trans exceeded its result for all of 2025 in four months and accounted for approximately 76% of the difference between the combined average monthly figures for the two periods. Mozyr Refinery retained first place, but its share declined to 50%. At the same time, Naftan's share decreased by nearly half.
Without SE Belorusneft-Trans, the average monthly tonnage of the other shippers under review would have been only 14.9% above the 2025 average, and without the two largest participants—SE Belorusneft-Trans and Mozyr Refinery—it would have been 16.4% lower. This demonstrates how narrow the base of the overall volume increase was.
Third, the higher intensity was not uniform across all participants. The average monthly tonnage of Mozyr Refinery was 26.8% above the 2025 average, Polimir 65.7% above, and RUE SG-Trans 44.4% above. At the same time, the figures for Naftan and LLC Logistic Energy were 21.3% and 55.5% below the 2025 average, respectively. Therefore, the higher combined average monthly volume cannot be described as a uniform picture across all participants.
Fourth, the share of gasoline and fuel oil declined from 69.2% to 65.0%. At the same time, the average monthly volume of diesel and jet fuel was 146.4% above the 2025 average, and oils and lubricants 101.7% above. The three largest fuel groups accounted for 82.7% of tonnage in 2025 and 83.2% in January–April 2026.
Fifth, the stable share of the port direction concealed a major redistribution among nodes. Average monthly shipments via Avtovo, Trusovo, and Novolesnaya were above the 2025 average, whereas the flow via Luzhskaya was lower. Four stations and four terminal consignees accounted for approximately 95% of port tonnage, demonstrating high concentration of the flow on a limited number of facilities.
Luzhskaya's share of the port flow declined from 36.6% to 14.2%, whereas the combined share of Avtovo, Trusovo, and Novolesnaya rose from 58.2% to 81.1%. Thus, the virtually unchanged share of the port direction concealed a shift in its primary railway gateways.
Sixth, the share of the direct Baltic direction declined to 0.07%. Only 1,417 tonnes were dispatched to Latvia and Lithuania. The average monthly volume of LPG and hydrocarbon fractions was 10.5% above the 2025 average level; 98.3% of the tonnage in this group was attributable to RUE SG-Trans. Average monthly Latvian shipments by several other shippers were significantly lower or not represented.
In summary, the period of January–April 2026 was characterized not only by higher intensity but also by further concentration of flows: on two shippers, two originating stations, and several Russian port terminals. At the same time, the structure of volumes by company, commodity, and destination node differed markedly from the structure for the full year 2025.
The figures for January–April 2026 are operational in nature and may be revised. The comparison was made with the average monthly level for the full year 2025; it is not a year-on-year comparison or a ready forecast for all of 2026. Mechanically extrapolating the four-month rate to the remainder of the year would not account for seasonality, changes in facility utilization, or possible route restructuring.
What changed after April 2026
The detailed railway figures on which the article's calculations and maps are based end in April 2026. Events in subsequent months are not included in these calculations and are provided only as context for assessing the further direction of changes.
According to Interfax data citing exchange statistics, in June 2026 sales of Belarusian gasoline on the Russian exchange market reached 90.9 thousand tonnes versus 25.2 thousand tonnes in June 2025, and diesel fuel 62.1 thousand versus 17.34 thousand tonnes. This indicates a growing role for the Russian market already after the period covered in the article. However, exchange sales do not equal actual railway shipments, so they cannot be used to continue the article's time series.
According to physical delivery data reported by Reform.news, from June 1 to 25, 141 thousand tonnes of Belarusian gasoline were dispatched to Russia—2.4 times more than for all of May. At the same time, transit of gasoline to third countries declined from 166 thousand tonnes in May to 24 thousand tonnes in June. This market-driven reorientation is consistent with the growing importance of the Russian direction but also does not permit calculation of railway tonnage without new detailed data.
Rossiyskaya Gazeta reported that in Q1 2026 transshipment of all Belarusian cargo through Russian ports increased by 11%, and among prospective projects the use of the Lavna terminal for Belarusian fertilizers, petroleum products, and containers was mentioned. The appearance of a destination at Kola station fits into a broader search for new nodes within Russian infrastructure, but the railway data in the article confirm only the destination station and consignee.
Events after April reinforce two previously observed processes: the growing role of the Russian market for a portion of Belarusian petroleum products and the search for additional port-adjacent nodes within the same Russian system. A precise assessment of their scale requires detailed data on railway shipments for May–December 2026; mechanically continuing the rate of the first four months to year-end is not feasible.
Conclusions
For 2025 and January–April 2026, the enterprises and logistics organizations under review dispatched by railway transport 105,225 railcars totaling 6,069,198 tonnes. This volume demonstrates the scale of the railway export segment for Belarusian petroleum products and petrochemical products under review. However, the main result of the study lies not in the sum for the two periods but in how rapidly the intensity, composition of participants, and geography of shipments changed.
The restructuring began before 2025. According to the broader network-wide category, export of oil and petroleum products from Belarus declined by 22.9% in 2024, and in the second half the volume of oil cargo through Russian ports was 45.3% lower than in the first half. When compared with 2024, southern and Caspian directions occupied a more prominent place in 2025, but the increase in their estimated volume was significantly smaller than the difference on the northwestern leg. Therefore, the higher average monthly intensity of early 2026 was observed in an already altered route system and did not signify a return to the previous export structure.
In January–April 2026, 2,025,757 tonnes were transported—50.1% of the result for all of 2025. The average monthly volume was 506.4 thousand tonnes versus 337.0 thousand tonnes in 2025, and the number of railcars 8,735 versus 5,857. The intensity of shipments in early 2026 was 50.3% higher than the average monthly level for 2025 by tonnage and 49.1% higher by railcars. This comparison is not a year-on-year dynamic or a forecast for all of 2026, but it demonstrates a substantially higher average monthly volume in the first four months.
The difference between average monthly figures was distributed extremely unevenly among participants. JSC Mozyr Refinery retained first place; however, its share declined from 59.3% in 2025 to 50.0% in January–April 2026. The main contribution to this increase came from SE Belorusneft-Trans: its share rose from 18.2% to 37.4%, and its average monthly tonnage more than tripled. In four months of 2026, SE Belorusneft-Trans exceeded its own result for all of 2025 and accounted for approximately 76% of the difference between the combined average monthly figures. At the same time, the average monthly figures for JSC Naftan and LLC Logistic Energy were 21.3% and 55.5% below the 2025 averages, respectively.
Consequently, the higher combined average monthly volume cannot be described as a uniform recovery across all enterprises. In January–April 2026, Mozyr Refinery and SE Belorusneft-Trans jointly accounted for 87.5% of tonnage, and together with Naftan 94.9% versus 91.7% for the same trio in 2025. The increase in Belorusneft-Trans's share primarily reflects a higher volume registered under the name of the logistics operator rather than a change in output at a single facility. In any case, the bulk of the increase over the average level was concentrated among a limited number of participants.
The commodity structure changed more slowly than the shipper structure. Gasolines and fuel oil accounted for 69.2% of tonnage in 2025 and 65.0% in January–April 2026. Together with diesel and jet fuel—and in 2025 also with gas oil—the three main fuel categories formed more than 82% of shipments in both periods. The share of gasoline and fuel oil declined because the average monthly volumes of other segments were higher relative to the 2025 level, not because of a reduction in gasoline and fuel oil shipments themselves. Therefore, this reflects a change in proportions within a still predominantly fuel-based cargo flow rather than deep commodity diversification.
Particularly notable was the difference in oil shipments: their average monthly volume was 101.7% above the 2025 average, primarily due to SE Belorusneft-Trans. In the LPG segment, average monthly tonnage was 10.5% higher, but RUE SG-Trans's share reached 98.3%, whereas the direct Latvian flow on a monthly basis was 92.1% lower. These two examples demonstrate that a higher average monthly volume for a particular commodity group does not necessarily mean an expansion in the circle of shippers or routes: it could be accompanied by even greater concentration of shipments.
The most stable element of the entire system remained its linkage to Russian infrastructure. In 2025, 99.3% of tonnage passed through Russian export stations or in the direction of consignees on the Russian railway network, and in January–April 2026, 99.93%. Over the entire sixteen-month period under review, direct shipments to Latvia and Lithuania totaled only 29,938 tonnes—less than 0.5% of the combined volume. Within the shipments under review, Russian transport infrastructure was virtually without alternative: it simultaneously provided the port corridor and distribution of cargo to destinations on the Russian railway network.
The ratio of the two main directions appeared outwardly stable: approximately 64% of cargo traveled via Russian export stations and ports, and an additional 35–36% in directions attributed to the Russian Federation. However, the railway destination did not always coincide with the final market. Among consignees in the Russian direction were terminals, oil depots, and logistics operators, after which products could continue onward. Therefore, this portion of the cargo flow cannot be interpreted entirely as domestic Russian consumption. At the same time, the composition of consignees demonstrates the dual role of the Russian system—as a transit-port corridor and as a distribution network among industrial, fuel, and logistics facilities.
Within the Russian system, port geography continued to change. In 2025, the importance of Astrakhan, Novorossiysk, and Makhachkala increased, and in January–April 2026 average monthly shipments via Avtovo, Trusovo, and Novolesnaya were above the 2025 average, whereas the flow via Luzhskaya was lower. In addition, in January–April 2026 a destination at Kola station consigned to LLC First Murmansk Terminal appeared. Port geography became broader within the Russian transport system, but this did not create an independent external alternative. New directions increased the possibility of redistributing cargo among Russian nodes without eliminating the overall dependence on the Russian network.
Concentration was evident at each main segment of the chain. The share of Barbarov and Novopolotsk stations rose from 95.9% of tonnage in 2025 to 99.9% in January–April 2026. In the port segment, four stations accounted for 95.3% of shipments, and the four largest terminal consignees 94.6%. The ability to shift flows among individual Russian terminals was combined with high sensitivity of the entire scheme to the operation of two Belarusian originating nodes and a small number of port facilities. Therefore, expanding the list of destination stations did not in itself eliminate infrastructure risks.
LLC Logistic Energy provides an illustrative example. After a sharp reduction in the company's role in 2025, its average monthly tonnage in January–April 2026 was an additional 55.5% below the 2025 average. At the same time, none of the previous full chains via Luzhskaya and Avtovo was repeated: diesel fuel was dispatched to the St. Petersburg Oil Terminal, and gasoline traveled in the Murmansk direction via Kola station consigned to LLC First Murmansk Terminal. In the data available to the Community, this direction is recorded for the first time. It expanded the geography, but its average monthly volume remained 71.4% below the company's previous gasoline flow via Luzhskaya to Portenergo. This vividly illustrates the difference between the appearance of a new route and the full restoration of lost volume.
The main result of the period under review is that the higher average monthly volume was accompanied by increased concentration and a shift in the distribution of cargo among Russian stations and terminals. The list of Russian nodes involved expanded; however, dependence on two Belarusian originating stations, the largest shippers, and a limited number of terminals persisted. The share of direct shipments to Latvia and Lithuania declined to 0.07%.